Python提取频域特征知识点浅析
在多数的现代语音识别系统中,人们都会用到频域特征。梅尔频率倒谱系数(MFCC),首先计算信号的功率谱,然后用滤波器和离散余弦变换的变换来提取特征。本文重点介绍如何提取MFCC特征。
首先创建有一个Python文件,并导入库文件: from scipy.io import wavfile from python_speech_features import mfcc, logfbank import matplotlib.pylab as plt1、首先创建有一个Python文件,并导入库文件: from scipy.io import wavfile from python_speech_features import mfcc, logfbank import matplotlib.pylab as plt
读取音频文件:
samplimg_freq, audio = wavfile.read("data/input_freq.wav")

提取MFCC特征和过滤器特征:
mfcc_features = mfcc(audio, samplimg_freq)
filterbank_features = logfbank(audio, samplimg_freq)

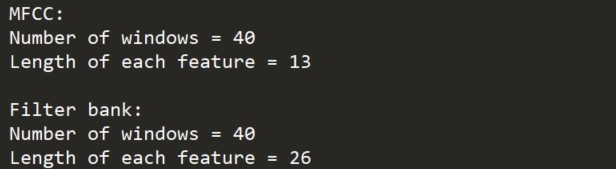
打印参数,查看可生成多少个窗体:
   print('\nMFCC:\nNumber of windows =', mfcc_features.shape[0])

   print('Length of each feature =', mfcc_features.shape[1])

   print('\nFilter bank:\nNumber of windows=', filterbank_features.shape                                                         [0])

   print('Length of each feature =', filterbank_features.shape[1])
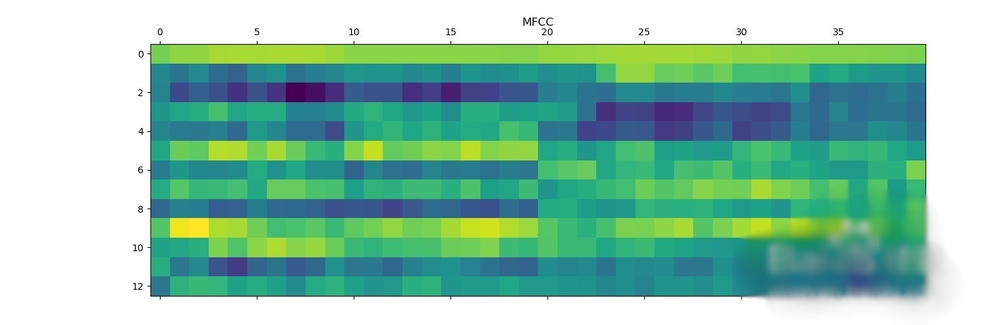
将MFCC特征可视化。转换矩阵,使得时域是水平的:
   mfcc_features = mfcc_features.T

   plt.matshow(mfcc_features)

   plt.title('MFCC')
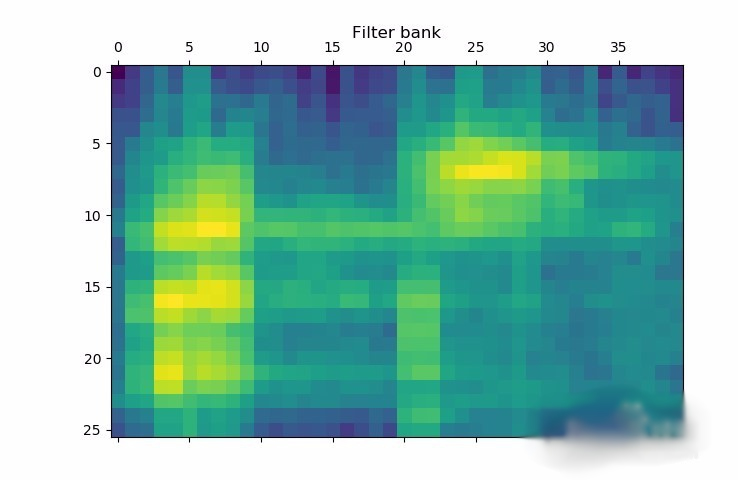
将滤波器组特征可视化。转化矩阵,使得时域是水平的:
   filterbank_features = filterbank_features.T

   plt.matshow(filterbank_features)

   plt.title('Filter bank')


   plt.show()