Python使用pylab库实现画线功能的方法详解
本文实例讲述了Python使用pylab库实现画线功能的方法。分享给大家供大家参考,具体如下:
pylab 提供了比较强大的画图功能,但是函数和参数都比较多,很容易搞混。我们平常使用最多的应该是画线了。下面,简单的对一些常用的划线函数进行了封装,方便使用。
# -*- coding: utf-8 -*-
import pylab
import random
class MiniPlotTool :
'''
A mini tool to draw lines using pylab
'''
basecolors = ['red','green','yellow','blue','black','cyan','magenta']
def __init__(self, baseConfig) :
self.figsize = baseConfig.get('figsize',None)
self.axis = baseConfig.get('axis',None)
self.title = baseConfig.get('title','NoName')
self.ylabel = baseConfig.get('ylabel','NoName')
self.grid = baseConfig.get('grid',False)
self.xaxis_locator = baseConfig.get('xaxis_locator',None)
self.yaxis_locator = baseConfig.get('yaxis_locator',None)
self.legend_loc = baseConfig.get('legend_loc',0)
if self.figsize != None :
pylab.figure(figsize = self.figsize)
if self.axis != None :
pylab.axis(self.axis)
pylab.title(self.title)
pylab.ylabel(self.ylabel)
ax = pylab.gca()
pylab.grid(self.grid)
if self.xaxis_locator != None :
ax.xaxis.set_major_locator( pylab.MultipleLocator(self.xaxis_locator) )
if self.yaxis_locator != None :
ax.yaxis.set_major_locator( pylab.MultipleLocator(self.yaxis_locator) )
self.lineList = []
self.id = 1
def addline(self, lineConf) :
self.lineList.append((self.id, lineConf))
self.id += 1
return {'id' : self.id - 1}
def removeline(self, lineId) :
for i in range(len(self.lineList)) :
id, conf = self.lineList[i]
if id == lineId :
del self.lineList[i]
break
else :
return {'status' : -1}
print len(self.lineList)
return {'status' : 0}
def __parselineConf(self, lineConf) :
X = lineConf['X']
Y = lineConf['Y']
marker = lineConf.get('marker',None)
color = lineConf.get('color', random.choice(MiniPlotTool.basecolors))
markerfacecolor = lineConf.get('markerfacecolor',color)
label = lineConf.get('label','NoName')
linewidth = lineConf.get('linewidth',1)
linestyle = lineConf.get('linestyle','-')
return X, Y, marker, color, markerfacecolor, label, linewidth, linestyle
def plotSingleLine(self, lineConf):
X, Y, marker, color, markerfacecolor, label, linewidth, linestyle = self.__parselineConf(lineConf)
pylab.plot(X, Y, marker = marker, color = color, markerfacecolor = markerfacecolor, label=label, linewidth = linewidth, linestyle = linestyle)
pylab.legend(loc = self.legend_loc)
def plot(self) :
colors = [MiniPlotTool.basecolors[i % len(MiniPlotTool.basecolors)] for i in range(len(self.lineList))]
for i in range(len(self.lineList)) :
id, conf = self.lineList[i]
if conf.get('color',None) :
conf['color'] = colors[i]
X, Y, marker, color, markerfacecolor, label, linewidth, linestyle = self.__parselineConf(conf)
pylab.plot(X, Y, marker = marker, color = color, markerfacecolor = markerfacecolor, label=label, linewidth = linewidth, linestyle = linestyle)
pylab.legend(loc = self.legend_loc)
def show(self) :
pylab.show()
if __name__ == '__main__' :
#test
baseConfig = {
#'figsize' : (6,8),
#'axis': [0,10,0,10],
#'title' : 'hello title',
#'ylabel' : 'hello ylabel',
'grid' : True,
#'xaxis_locator' : 0.5,
#'yaxis_locator' : 1,
#'legend_loc' : 'upper right'
}
tool = MiniPlotTool(baseConfig)
X = [ i for i in range(10)]
Y = [random.randint(1,10) for i in range(10)]
Y2 = [random.randint(1,10) for i in range(10)]
lineConf = {
'X' : X,
'Y' : Y
#'marker' : 'x',
#'color' : 'b',
#'markerfacecolor' : 'r',
#'label' : '222',
#'linewidth' : 3,
#'linestyle' : '--'
}
lineConf2 = {
'X' : X,
'Y' : Y2,
'marker' : 'o',
'color' : 'b',
'markerfacecolor' : 'r',
'label' : '222',
'linewidth' : 3,
'linestyle' : '--'
}
#tool.plotSingleLine(lineConf)
print tool.addline(lineConf)
print tool.addline(lineConf2)
#print tool.removeline(1)
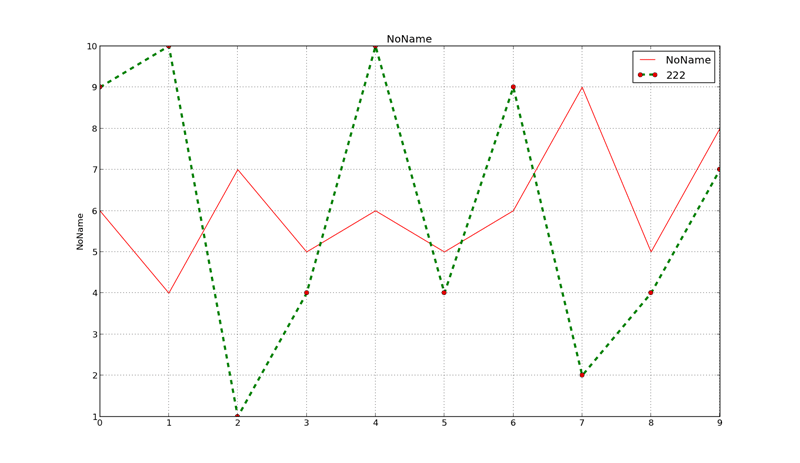
tool.plot()
tool.show()
运行效果图如下:
附:引用自:https://sites.google.com/site/guyingbo/matplotlib%E5%AD%A6%E4%B9%A0%E7%AC%94%E8%AE%B0
线属性:
颜色(color 简写为 c):
蓝色: 'b' (blue)
绿色: 'g' (green)
红色: 'r' (red)
蓝绿色(墨绿色): 'c' (cyan)
红紫色(洋红): 'm' (magenta)
黄色: 'y' (yellow)
黑色: 'k' (black)
白色: 'w' (white)
灰度表示: e.g. 0.75 ([0,1]内任意浮点数)
RGB表示法: e.g. '#2F4F4F' 或 (0.18, 0.31, 0.31)
任意合法的html中的颜色表示: e.g. 'red', 'darkslategray'
线型(linestyle 简写为 ls):
实线: '-'
虚线: '--'
虚点线: '-.'
点线: ':'
点: '.'
点型(标记marker):
像素: ','
圆形: 'o'
上三角: '^'
下三角: 'v'
左三角: '<'
右三角: '>'
方形: 's'
加号: '+'
叉形: 'x'
棱形: 'D'
细棱形: 'd'
三脚架朝下: '1'(就是丫)
三脚架朝上: '2'
三脚架朝左: '3'
三脚架朝右: '4'
六角形: 'h'
旋转六角形: 'H'
五角形: 'p'
垂直线: '|'
水平线: '_'
gnuplot 中的steps: 'steps' (只能用于kwarg中)
标记大小(markersize 简写为 ms):
markersize: 实数
标记边缘宽度(markeredgewidth 简写为 mew):
markeredgewidth:实数
标记边缘颜色(markeredgecolor 简写为 mec):
markeredgecolor:颜色选项中的任意值
标记表面颜色(markerfacecolor 简写为 mfc):
markerfacecolor:颜色选项中的任意值
透明度(alpha):
alpha: [0,1]之间的浮点数
线宽(linewidth):
linewidth: 实数
更多关于Python相关内容感兴趣的读者可查看本站专题:《Python图片操作技巧总结》、《Python数据结构与算法教程》、《Python函数使用技巧总结》、《Python字符串操作技巧汇总》、《Python入门与进阶经典教程》及《Python文件与目录操作技巧汇总》
希望本文所述对大家Python程序设计有所帮助。