详解用TensorFlow实现逻辑回归算法
本文将实现逻辑回归算法,预测低出生体重的概率。
# Logistic Regression
# 逻辑回归
#----------------------------------
#
# This function shows how to use TensorFlow to
# solve logistic regression.
# y = sigmoid(Ax + b)
#
# We will use the low birth weight data, specifically:
# y = 0 or 1 = low birth weight
# x = demographic and medical history data
import matplotlib.pyplot as plt
import numpy as np
import tensorflow as tf
import requests
from tensorflow.python.framework import ops
import os.path
import csv
ops.reset_default_graph()
# Create graph
sess = tf.Session()
###
# Obtain and prepare data for modeling
###
# name of data file
birth_weight_file = 'birth_weight.csv'
# download data and create data file if file does not exist in current directory
if not os.path.exists(birth_weight_file):
birthdata_url = 'https://github.com/nfmcclure/tensorflow_cookbook/raw/master/01_Introduction/07_Working_with_Data_Sources/birthweight_data/birthweight.dat'
birth_file = requests.get(birthdata_url)
birth_data = birth_file.text.split('\r\n')
birth_header = birth_data[0].split('\t')
birth_data = [[float(x) for x in y.split('\t') if len(x)>=1] for y in birth_data[1:] if len(y)>=1]
with open(birth_weight_file, "w") as f:
writer = csv.writer(f)
writer.writerow(birth_header)
writer.writerows(birth_data)
f.close()
# read birth weight data into memory
birth_data = []
with open(birth_weight_file, newline='') as csvfile:
csv_reader = csv.reader(csvfile)
birth_header = next(csv_reader)
for row in csv_reader:
birth_data.append(row)
birth_data = [[float(x) for x in row] for row in birth_data]
# Pull out target variable
y_vals = np.array([x[0] for x in birth_data])
# Pull out predictor variables (not id, not target, and not birthweight)
x_vals = np.array([x[1:8] for x in birth_data])
# set for reproducible results
seed = 99
np.random.seed(seed)
tf.set_random_seed(seed)
# Split data into train/test = 80%/20%
# 分割数据集为测试集和训练集
train_indices = np.random.choice(len(x_vals), round(len(x_vals)*0.8), replace=False)
test_indices = np.array(list(set(range(len(x_vals))) - set(train_indices)))
x_vals_train = x_vals[train_indices]
x_vals_test = x_vals[test_indices]
y_vals_train = y_vals[train_indices]
y_vals_test = y_vals[test_indices]
# Normalize by column (min-max norm)
# 将所有特征缩放到0和1区间(min-max缩放),逻辑回归收敛的效果更好
# 归一化特征
def normalize_cols(m):
col_max = m.max(axis=0)
col_min = m.min(axis=0)
return (m-col_min) / (col_max - col_min)
x_vals_train = np.nan_to_num(normalize_cols(x_vals_train))
x_vals_test = np.nan_to_num(normalize_cols(x_vals_test))
###
# Define Tensorflow computational graph
###
# Declare batch size
batch_size = 25
# Initialize placeholders
x_data = tf.placeholder(shape=[None, 7], dtype=tf.float32)
y_target = tf.placeholder(shape=[None, 1], dtype=tf.float32)
# Create variables for linear regression
A = tf.Variable(tf.random_normal(shape=[7,1]))
b = tf.Variable(tf.random_normal(shape=[1,1]))
# Declare model operations
model_output = tf.add(tf.matmul(x_data, A), b)
# Declare loss function (Cross Entropy loss)
loss = tf.reduce_mean(tf.nn.sigmoid_cross_entropy_with_logits(logits=model_output, labels=y_target))
# Declare optimizer
my_opt = tf.train.GradientDescentOptimizer(0.01)
train_step = my_opt.minimize(loss)
###
# Train model
###
# Initialize variables
init = tf.global_variables_initializer()
sess.run(init)
# Actual Prediction
# 除记录损失函数外,也需要记录分类器在训练集和测试集上的准确度。
# 所以创建一个返回准确度的预测函数
prediction = tf.round(tf.sigmoid(model_output))
predictions_correct = tf.cast(tf.equal(prediction, y_target), tf.float32)
accuracy = tf.reduce_mean(predictions_correct)
# Training loop
# 开始遍历迭代训练,记录损失值和准确度
loss_vec = []
train_acc = []
test_acc = []
for i in range(1500):
rand_index = np.random.choice(len(x_vals_train), size=batch_size)
rand_x = x_vals_train[rand_index]
rand_y = np.transpose([y_vals_train[rand_index]])
sess.run(train_step, feed_dict={x_data: rand_x, y_target: rand_y})
temp_loss = sess.run(loss, feed_dict={x_data: rand_x, y_target: rand_y})
loss_vec.append(temp_loss)
temp_acc_train = sess.run(accuracy, feed_dict={x_data: x_vals_train, y_target: np.transpose([y_vals_train])})
train_acc.append(temp_acc_train)
temp_acc_test = sess.run(accuracy, feed_dict={x_data: x_vals_test, y_target: np.transpose([y_vals_test])})
test_acc.append(temp_acc_test)
if (i+1)%300==0:
print('Loss = ' + str(temp_loss))
###
# Display model performance
###
# 绘制损失和准确度
plt.plot(loss_vec, 'k-')
plt.title('Cross Entropy Loss per Generation')
plt.xlabel('Generation')
plt.ylabel('Cross Entropy Loss')
plt.show()
# Plot train and test accuracy
plt.plot(train_acc, 'k-', label='Train Set Accuracy')
plt.plot(test_acc, 'r--', label='Test Set Accuracy')
plt.title('Train and Test Accuracy')
plt.xlabel('Generation')
plt.ylabel('Accuracy')
plt.legend(loc='lower right')
plt.show()
数据结果:
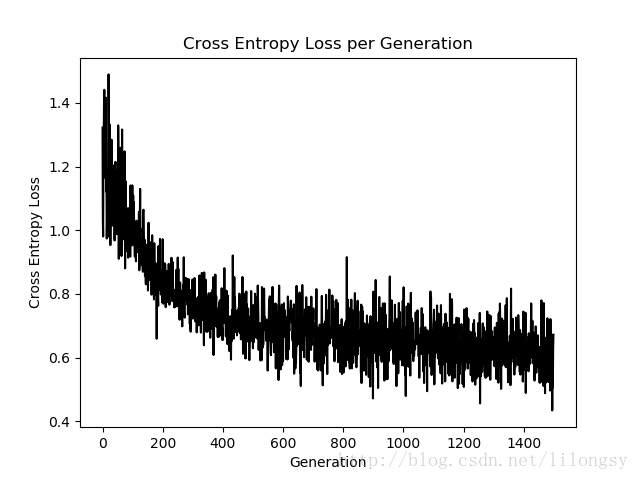
Loss = 0.845124
Loss = 0.658061
Loss = 0.471852
Loss = 0.643469
Loss = 0.672077

迭代1500次的交叉熵损失图

迭代1500次的测试集和训练集的准确度图
以上就是本文的全部内容,希望对大家的学习有所帮助,也希望大家多多支持【听图阁-专注于Python设计】。

