使用sklearn进行对数据标准化、归一化以及将数据还原的方法
在对模型训练时,为了让模型尽快收敛,一件常做的事情就是对数据进行预处理。
这里通过使用sklearn.preprocess模块进行处理。
一、标准化和归一化的区别
归一化其实就是标准化的一种方式,只不过归一化是将数据映射到了[0,1]这个区间中。
标准化则是将数据按照比例缩放,使之放到一个特定区间中。标准化后的数据的均值=0,标准差=1,因而标准化的数据可正可负。
二、使用sklearn进行标准化和标准化还原
原理:
即先求出全部数据的均值和方差,再进行计算。
最后的结果均值为0,方差是1,从公式就可以看出。
但是当原始数据并不符合高斯分布的话,标准化后的数据效果并不好。
导入模块
from sklearn.preprocessing import StandardScaler
from sklearn.preprocessing import MinMaxScaler
from matplotlib import gridspec
import numpy as np
import matplotlib.pyplot as plt
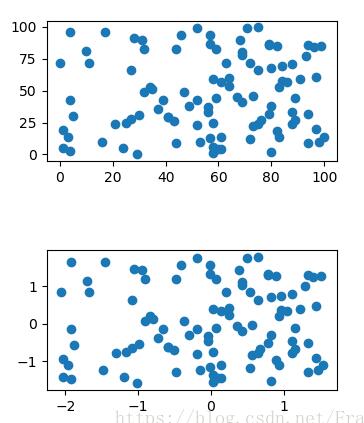
通过生成随机点可以对比出标准化前后的数据分布形状并没有发生变化,只是尺度上缩小了。
cps = np.random.random_integers(0, 100, (100, 2))

ss = StandardScaler()
std_cps = ss.fit_transform(cps)

gs = gridspec.GridSpec(5,5)
fig = plt.figure()
ax1 = fig.add_subplot(gs[0:2, 1:4])
ax2 = fig.add_subplot(gs[3:5, 1:4])

ax1.scatter(cps[:, 0], cps[:, 1])
ax2.scatter(std_cps[:, 0], std_cps[:, 1])

plt.show()
sklearn.preprocess.StandardScaler的使用:
先是创建对象,然后调用fit_transform()方法,需要传入一个如下格式的参数作为训练集。
X : numpy array of shape [n_samples,n_features]Training set.
data = np.random.uniform(0, 100, 10)[:, np.newaxis]
ss = StandardScaler()
std_data = ss.fit_transform(data)
origin_data = ss.inverse_transform(std_data)
print('data is ',data)
print('after standard ',std_data)
print('after inverse ',origin_data)
print('after standard mean and std is ',np.mean(std_data), np.std(std_data))
通过invers_tainsform()方法就可以得到原来的数据。
打印结果如下:
可以看到生成的数据的标准差是1,均值接近0。
data is [[15.72836992]
 [62.0709697 ]
 [94.85738359]
 [98.37108557]
 [ 0.16131774]
 [23.85445883]
 [26.40359246]
 [95.68204855]
 [77.69245742]
 [62.4002485 ]]
after standard [[-1.15085842]
 [ 0.18269178]
 [ 1.12615048]
 [ 1.22726043]
 [-1.59881442]
 [-0.91702287]
 [-0.84366924]
 [ 1.14988096]
 [ 0.63221421]
 [ 0.19216708]]
after inverse [[15.72836992]
 [62.0709697 ]
 [94.85738359]
 [98.37108557]
 [ 0.16131774]
 [23.85445883]
 [26.40359246]
 [95.68204855]
 [77.69245742]
 [62.4002485 ]]
after standard mean and std is -1.8041124150158794e-16 1.0
三、使用sklearn进行数据的归一化和归一化还原
原理:
从上式可以看出归一化的结果跟数据的最大值最小值有关。
使用时类似上面的标准化
data = np.random.uniform(0, 100, 10)[:, np.newaxis]
mm = MinMaxScaler()
mm_data = mm.fit_transform(data)
origin_data = mm.inverse_transform(mm_data)
print('data is ',data)
print('after Min Max ',mm_data)
print('origin data is ',origin_data)
结果:
G:\Anaconda\python.exe G:/python/DRL/DRL_test/DRL_ALL/Grammar.py
data is [[12.19502214]
 [86.49880021]
 [53.10501326]
 [82.30089405]
 [44.46306969]
 [14.51448347]
 [54.59806596]
 [87.87501465]
 [64.35007178]
 [ 4.96199642]]
after Min Max [[0.08723631]
 [0.98340171]
 [0.58064485]
 [0.93277147]
 [0.47641582]
 [0.11521094]
 [0.59865231]
 [1.  ]
 [0.71626961]
 [0.  ]]
origin data is [[12.19502214]
 [86.49880021]
 [53.10501326]
 [82.30089405]
 [44.46306969]
 [14.51448347]
 [54.59806596]
 [87.87501465]
 [64.35007178]
 [ 4.96199642]]

Process finished with exit code 0
其他标准化的方法:
上面的标准化和归一化都有一个缺点就是每当来一个新的数据的时候就要重新计算所有的点。
因而当数据是动态的时候可以使用下面的几种计算方法:
1、arctan反正切函数标准化:
2、ln函数标准化
以上这篇使用sklearn进行对数据标准化、归一化以及将数据还原的方法就是小编分享给大家的全部内容了,希望能给大家一个参考,也希望大家多多支持【听图阁-专注于Python设计】。
