浅析Python+OpenCV使用摄像头追踪人脸面部血液变化实现脉搏评估
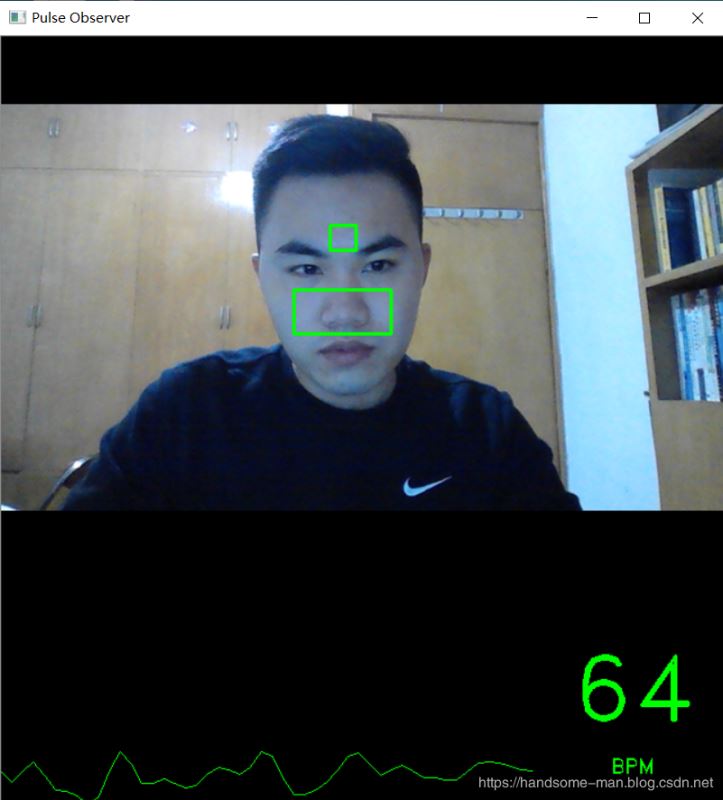
使用摄像头追踪人脸由于血液流动引起的面部色素的微小变化实现实时脉搏评估。
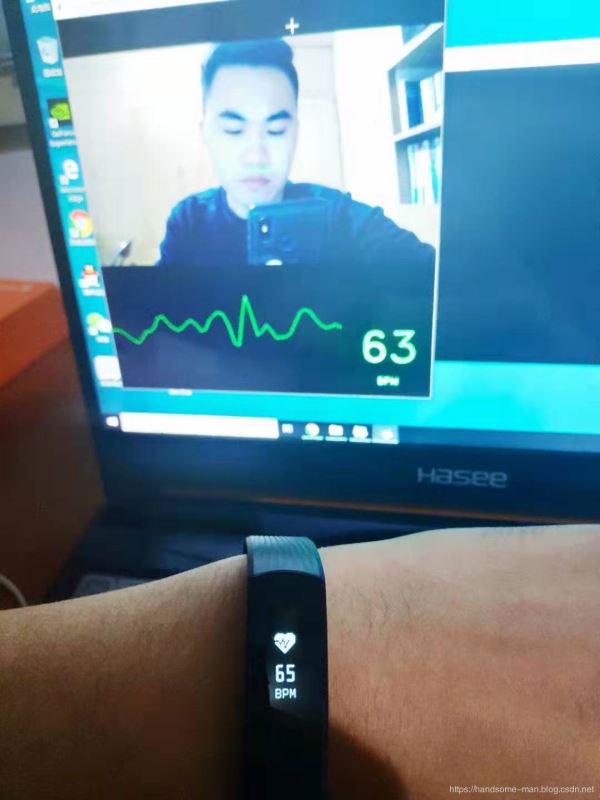
效果如下(演示视频):


由于这是通过比较面部色素的变化评估脉搏所以光线、人体移动、不同角度、不同电脑摄像头等因素均会影响评估效果,实验原理是面部色素对比,识别效果存在一定误差,各位小伙伴且当娱乐,代码如下:
import cv2
import numpy as np
import dlib
import time
from scipy import signal
# Constants
WINDOW_TITLE = 'Pulse Observer'
BUFFER_MAX_SIZE = 500  # Number of recent ROI average values to store
MAX_VALUES_TO_GRAPH = 50 # Number of recent ROI average values to show in the pulse graph
MIN_HZ = 0.83  # 50 BPM - minimum allowed heart rate
MAX_HZ = 3.33  # 200 BPM - maximum allowed heart rate
MIN_FRAMES = 100 # Minimum number of frames required before heart rate is computed. Higher values are slower, but
     # more accurate.
DEBUG_MODE = False
# Creates the specified Butterworth filter and applies it.
def butterworth_filter(data, low, high, sample_rate, order=5):
 nyquist_rate = sample_rate * 0.5
 low /= nyquist_rate
 high /= nyquist_rate
 b, a = signal.butter(order, [low, high], btype='band')
 return signal.lfilter(b, a, data)
# Gets the region of interest for the forehead.
def get_forehead_roi(face_points):
 # Store the points in a Numpy array so we can easily get the min and max for x and y via slicing
 points = np.zeros((len(face_points.parts()), 2))
 for i, part in enumerate(face_points.parts()):
  points[i] = (part.x, part.y)
 min_x = int(points[21, 0])
 min_y = int(min(points[21, 1], points[22, 1]))
 max_x = int(points[22, 0])
 max_y = int(max(points[21, 1], points[22, 1]))
 left = min_x
 right = max_x
 top = min_y - (max_x - min_x)
 bottom = max_y * 0.98
 return int(left), int(right), int(top), int(bottom)
# Gets the region of interest for the nose.
def get_nose_roi(face_points):
 points = np.zeros((len(face_points.parts()), 2))
 for i, part in enumerate(face_points.parts()):
  points[i] = (part.x, part.y)
 # Nose and cheeks
 min_x = int(points[36, 0])
 min_y = int(points[28, 1])
 max_x = int(points[45, 0])
 max_y = int(points[33, 1])
 left = min_x
 right = max_x
 top = min_y + (min_y * 0.02)
 bottom = max_y + (max_y * 0.02)
 return int(left), int(right), int(top), int(bottom)
# Gets region of interest that includes forehead, eyes, and nose.
# Note: Combination of forehead and nose performs better. This is probably because this ROI includes eyes,
# and eye blinking adds noise.
def get_full_roi(face_points):
 points = np.zeros((len(face_points.parts()), 2))
 for i, part in enumerate(face_points.parts()):
  points[i] = (part.x, part.y)
 # Only keep the points that correspond to the internal features of the face (e.g. mouth, nose, eyes, brows).
 # The points outlining the jaw are discarded.
 min_x = int(np.min(points[17:47, 0]))
 min_y = int(np.min(points[17:47, 1]))
 max_x = int(np.max(points[17:47, 0]))
 max_y = int(np.max(points[17:47, 1]))
 center_x = min_x + (max_x - min_x) / 2
 left = min_x + int((center_x - min_x) * 0.15)
 right = max_x - int((max_x - center_x) * 0.15)
 top = int(min_y * 0.88)
 bottom = max_y
 return int(left), int(right), int(top), int(bottom)
def sliding_window_demean(signal_values, num_windows):
 window_size = int(round(len(signal_values) / num_windows))
 demeaned = np.zeros(signal_values.shape)
 for i in range(0, len(signal_values), window_size):
  if i + window_size > len(signal_values):
   window_size = len(signal_values) - i
  curr_slice = signal_values[i: i + window_size]
  if DEBUG_MODE and curr_slice.size == 0:
   print ('Empty Slice: size={0}, i={1}, window_size={2}'.format(signal_values.size, i, window_size))
   print (curr_slice)
  demeaned[i:i + window_size] = curr_slice - np.mean(curr_slice)
 return demeaned
# Averages the green values for two arrays of pixels
def get_avg(roi1, roi2):
 roi1_green = roi1[:, :, 1]
 roi2_green = roi2[:, :, 1]
 avg = (np.mean(roi1_green) + np.mean(roi2_green)) / 2.0
 return avg
# Returns maximum absolute value from a list
def get_max_abs(lst):
 return max(max(lst), -min(lst))
# Draws the heart rate graph in the GUI window.
def draw_graph(signal_values, graph_width, graph_height):
 graph = np.zeros((graph_height, graph_width, 3), np.uint8)
 scale_factor_x = float(graph_width) / MAX_VALUES_TO_GRAPH
 # Automatically rescale vertically based on the value with largest absolute value
 max_abs = get_max_abs(signal_values)
 scale_factor_y = (float(graph_height) / 2.0) / max_abs
 midpoint_y = graph_height / 2
 for i in range(0, len(signal_values) - 1):
  curr_x = int(i * scale_factor_x)
  curr_y = int(midpoint_y + signal_values[i] * scale_factor_y)
  next_x = int((i + 1) * scale_factor_x)
  next_y = int(midpoint_y + signal_values[i + 1] * scale_factor_y)
  cv2.line(graph, (curr_x, curr_y), (next_x, next_y), color=(0, 255, 0), thickness=1)
 return graph
# Draws the heart rate text (BPM) in the GUI window.
def draw_bpm(bpm_str, bpm_width, bpm_height):
 bpm_display = np.zeros((bpm_height, bpm_width, 3), np.uint8)
 bpm_text_size, bpm_text_base = cv2.getTextSize(bpm_str, fontFace=cv2.FONT_HERSHEY_DUPLEX, fontScale=2.7,
             thickness=2)
 bpm_text_x = int((bpm_width - bpm_text_size[0]) / 2)
 bpm_text_y = int(bpm_height / 2 + bpm_text_base)
 cv2.putText(bpm_display, bpm_str, (bpm_text_x, bpm_text_y), fontFace=cv2.FONT_HERSHEY_DUPLEX,
    fontScale=2.7, color=(0, 255, 0), thickness=2)
 bpm_label_size, bpm_label_base = cv2.getTextSize('BPM', fontFace=cv2.FONT_HERSHEY_DUPLEX, fontScale=0.6,
              thickness=1)
 bpm_label_x = int((bpm_width - bpm_label_size[0]) / 2)
 bpm_label_y = int(bpm_height - bpm_label_size[1] * 2)
 cv2.putText(bpm_display, 'BPM', (bpm_label_x, bpm_label_y),
    fontFace=cv2.FONT_HERSHEY_DUPLEX, fontScale=0.6, color=(0, 255, 0), thickness=1)
 return bpm_display
# Draws the current frames per second in the GUI window.
def draw_fps(frame, fps):
 cv2.rectangle(frame, (0, 0), (100, 30), color=(0, 0, 0), thickness=-1)
 cv2.putText(frame, 'FPS: ' + str(round(fps, 2)), (5, 20), fontFace=cv2.FONT_HERSHEY_PLAIN,
    fontScale=1, color=(0, 255, 0))
 return frame
# Draw text in the graph area
def draw_graph_text(text, color, graph_width, graph_height):
 graph = np.zeros((graph_height, graph_width, 3), np.uint8)
 text_size, text_base = cv2.getTextSize(text, fontFace=cv2.FONT_HERSHEY_DUPLEX, fontScale=1, thickness=1)
 text_x = int((graph_width - text_size[0]) / 2)
 text_y = int((graph_height / 2 + text_base))
 cv2.putText(graph, text, (text_x, text_y), fontFace=cv2.FONT_HERSHEY_DUPLEX, fontScale=1, color=color,
    thickness=1)
 return graph
# Calculate the pulse in beats per minute (BPM)
def compute_bpm(filtered_values, fps, buffer_size, last_bpm):
 # Compute FFT
 fft = np.abs(np.fft.rfft(filtered_values))
 # Generate list of frequencies that correspond to the FFT values
 freqs = fps / buffer_size * np.arange(buffer_size / 2 + 1)
 # Filter out any peaks in the FFT that are not within our range of [MIN_HZ, MAX_HZ]
 # because they correspond to impossible BPM values.
 while True:
  max_idx = fft.argmax()
  bps = freqs[max_idx]
  if bps < MIN_HZ or bps > MAX_HZ:
   if DEBUG_MODE:
    print ('BPM of {0} was discarded.'.format(bps * 60.0))
   fft[max_idx] = 0
  else:
   bpm = bps * 60.0
   break
 # It's impossible for the heart rate to change more than 10% between samples,
 # so use a weighted average to smooth the BPM with the last BPM.
 if last_bpm > 0:
  bpm = (last_bpm * 0.9) + (bpm * 0.1)
 return bpm
def filter_signal_data(values, fps):
 # Ensure that array doesn't have infinite or NaN values
 values = np.array(values)
 np.nan_to_num(values, copy=False)
 # Smooth the signal by detrending and demeaning
 detrended = signal.detrend(values, type='linear')
 demeaned = sliding_window_demean(detrended, 15)
 # Filter signal with Butterworth bandpass filter
 filtered = butterworth_filter(demeaned, MIN_HZ, MAX_HZ, fps, order=5)
 return filtered
# Get the average value for the regions of interest. Will also draw a green rectangle around
# the regions of interest, if requested.
def get_roi_avg(frame, view, face_points, draw_rect=True):
 # Get the regions of interest.
 fh_left, fh_right, fh_top, fh_bottom = get_forehead_roi(face_points)
 nose_left, nose_right, nose_top, nose_bottom = get_nose_roi(face_points)
 # Draw green rectangles around our regions of interest (ROI)
 if draw_rect:
  cv2.rectangle(view, (fh_left, fh_top), (fh_right, fh_bottom), color=(0, 255, 0), thickness=2)
  cv2.rectangle(view, (nose_left, nose_top), (nose_right, nose_bottom), color=(0, 255, 0), thickness=2)
 # Slice out the regions of interest (ROI) and average them
 fh_roi = frame[fh_top:fh_bottom, fh_left:fh_right]
 nose_roi = frame[nose_top:nose_bottom, nose_left:nose_right]
 return get_avg(fh_roi, nose_roi)
# Main function.
def run_pulse_observer(detector, predictor, webcam, window):
 roi_avg_values = []
 graph_values = []
 times = []
 last_bpm = 0
 graph_height = 200
 graph_width = 0
 bpm_display_width = 0
 # cv2.getWindowProperty() returns -1 when window is closed by user.
 while cv2.getWindowProperty(window, 0) == 0:
  ret_val, frame = webcam.read()
  # ret_val == False if unable to read from webcam
  if not ret_val:
   print ("ERROR: Unable to read from webcam. Was the webcam disconnected? Exiting.")
   shut_down(webcam)
  # Make copy of frame before we draw on it. We'll display the copy in the GUI.
  # The original frame will be used to compute heart rate.
  view = np.array(frame)
  # Heart rate graph gets 75% of window width. BPM gets 25%.
  if graph_width == 0:
   graph_width = int(view.shape[1] * 0.75)
   if DEBUG_MODE:
    print ('Graph width = {0}'.format(graph_width))
  if bpm_display_width == 0:
   bpm_display_width = view.shape[1] - graph_width
  # Detect face using dlib
  faces = detector(frame, 0)
  if len(faces) == 1:
   face_points = predictor(frame, faces[0])
   roi_avg = get_roi_avg(frame, view, face_points, draw_rect=True)
   roi_avg_values.append(roi_avg)
   times.append(time.time())
   # Buffer is full, so pop the value off the top to get rid of it
   if len(times) > BUFFER_MAX_SIZE:
    roi_avg_values.pop(0)
    times.pop(0)
   curr_buffer_size = len(times)
   # Don't try to compute pulse until we have at least the min. number of frames
   if curr_buffer_size > MIN_FRAMES:
    # Compute relevant times
    time_elapsed = times[-1] - times[0]
    fps = curr_buffer_size / time_elapsed # frames per second
    # Clean up the signal data
    filtered = filter_signal_data(roi_avg_values, fps)
    graph_values.append(filtered[-1])
    if len(graph_values) > MAX_VALUES_TO_GRAPH:
     graph_values.pop(0)
    # Draw the pulse graph
    graph = draw_graph(graph_values, graph_width, graph_height)
    # Compute and display the BPM
    bpm = compute_bpm(filtered, fps, curr_buffer_size, last_bpm)
    bpm_display = draw_bpm(str(int(round(bpm))), bpm_display_width, graph_height)
    last_bpm = bpm
    # Display the FPS
    if DEBUG_MODE:
     view = draw_fps(view, fps)
   else:
    # If there's not enough data to compute HR, show an empty graph with loading text and
    # the BPM placeholder
    pct = int(round(float(curr_buffer_size) / MIN_FRAMES * 100.0))
    loading_text = 'Computing pulse: ' + str(pct) + '%'
    graph = draw_graph_text(loading_text, (0, 255, 0), graph_width, graph_height)
    bpm_display = draw_bpm('--', bpm_display_width, graph_height)
  else:
   # No faces detected, so we must clear the lists of values and timestamps. Otherwise there will be a gap
   # in timestamps when a face is detected again.
   del roi_avg_values[:]
   del times[:]
   graph = draw_graph_text('No face detected', (0, 0, 255), graph_width, graph_height)
   bpm_display = draw_bpm('--', bpm_display_width, graph_height)
  graph = np.hstack((graph, bpm_display))
  view = np.vstack((view, graph))
  cv2.imshow(window, view)
  key = cv2.waitKey(1)
  # Exit if user presses the escape key
  if key == 27:
   shut_down(webcam)
# Clean up
def shut_down(webcam):
 webcam.release()
 cv2.destroyAllWindows()
 exit(0)
def main():
 detector = dlib.get_frontal_face_detector()
 # Predictor pre-trained model can be downloaded from:
 # http://sourceforge.net/projects/dclib/files/dlib/v18.10/shape_predictor_68_face_landmarks.dat.bz2
 try:
  predictor = dlib.shape_predictor('shape_predictor_68_face_landmarks.dat')
 except RuntimeError as e:
  print ('ERROR: \'shape_predictor_68_face_landmarks.dat\' was not found in current directory. ' \
    'Download it from http://sourceforge.net/projects/dclib/files/dlib/v18.10/shape_predictor_68_face_landmarks.dat.bz2')
  return
 webcam = cv2.VideoCapture(0)
 if not webcam.isOpened():
  print ('ERROR: Unable to open webcam. Verify that webcam is connected and try again. Exiting.')
  webcam.release()
  return
 cv2.namedWindow(WINDOW_TITLE)
 run_pulse_observer(detector, predictor, webcam, WINDOW_TITLE)
 # run_pulse_observer() returns when the user has closed the window. Time to shut down.
 shut_down(webcam)
if __name__ == '__main__':
 main()
总结
以上所述是小编给大家介绍的浅析Python+OpenCV使用摄像头追踪人脸面部血液变化实现脉搏评估,希望对大家有所帮助,如果大家有任何疑问请给我留言,小编会及时回复大家的。在此也非常感谢大家对【听图阁-专注于Python设计】网站的支持!
如果你觉得本文对你有帮助,欢迎转载,烦请注明出处,谢谢!

