python/Matplotlib绘制复变函数图像教程
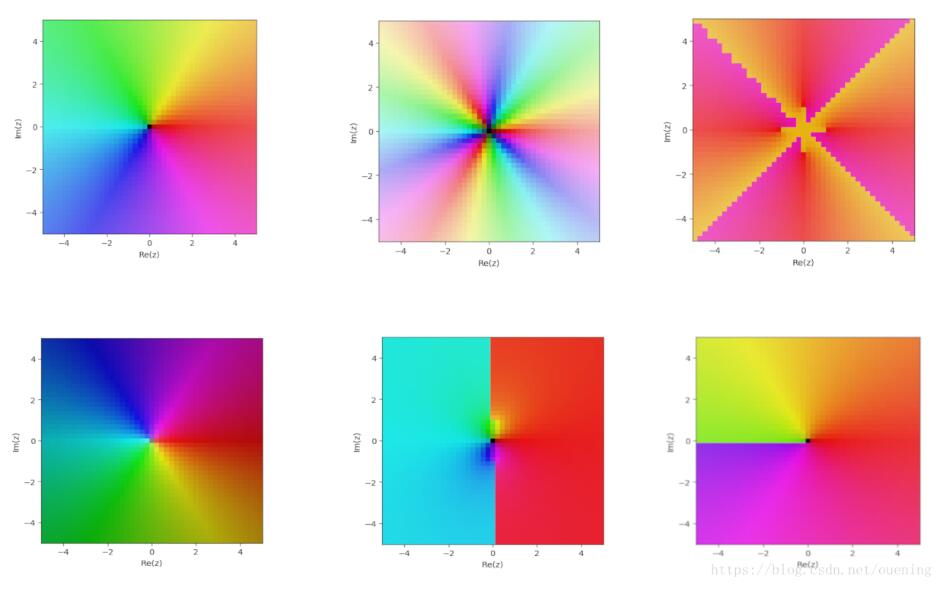
今天发现sympy依赖的库mpmath里也有很多数学函数,其中也有在复平面绘制二维图的函数cplot,具体例子如下
from mpmath import *

def f1(z):
 return z

def f2(z):
 return z**3

def f3(z):
 return (z**4-1)**(1/4)

def f4(z):
 return 1/z

def f5(z):
 return atan(z)

def f6(z):
 return sqrt(z)

cplot(f1)
cplot(f2)
cplot(f3)
cplot(f4)
cplot(f5)
cplot(f6)
参照matlab绘制复变函数的例子,使用python实现绘制复变函数图像,网上还没搜到相关的文章,在这里分享出来供大家学习。
'''
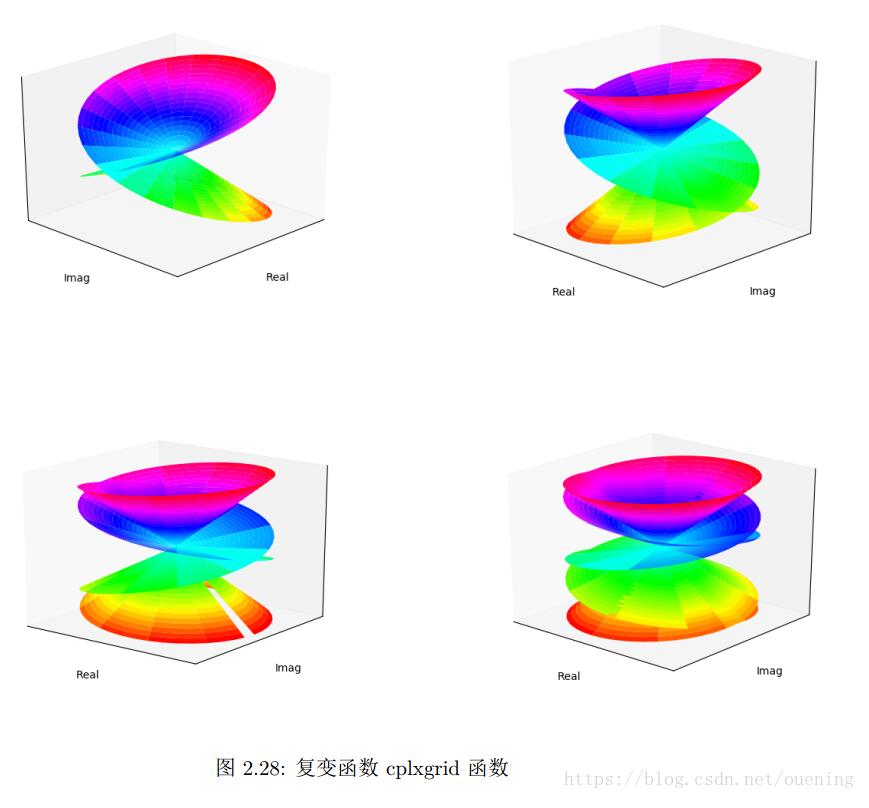
参照matlab绘制复变函数的例子,创建函数cplxgrid,cplxmap,cplxroot
'''
# 1.导入相关库
import numpy as np
import matplotlib.pyplot as plt
from mpl_toolkits.mplot3d import *
# 2.创建函数
def cplxgrid(m):
'''Return polar coordinate complex grid.
Parameters
----------
m: int
Returns
----------
z: ndarray,with shape (m+1)-by-(2*(m+1))
'''
m = m
r = np.arange(0,m).reshape(m,1) / m
theta = np.pi * np.arange(-m,m) / m
z = r * np.exp(1j * theta)
return z
def cplxroot(n=3,m=20):
'''
cplxroot(n): renders the Riemann surface for the n-th root
cplxroot(): renders the Riemann surface for the cube root.
cplxroot(n,m): uses an m-by-m grid. Default m = 20.
Use polar coordinates, (r,theta).
Use polar coordinates, (r,theta).
Parameters
----------
n: n-th root
m: int
Returns
----------
None: Plot the Riemann surface
'''
m = m+1
r = np.arange(0,m).reshape(m,1) / m
theta = np.pi * np.arange(-n * m, n * m) / m
z = r * np.exp(1j * theta)
s = r * (1/n) * np.exp(1j * theta / n)
fig = plt.figure()
ax = fig.add_subplot(111,projection='3d')
# ax.plot_surface(np.real(z),np.imag(z),np.real(s),color = np.imag(s))
ax.plot_surface(np.real(z),np.imag(z),np.real(s),cmap = plt.cm.hsv)
ax.set_xlim((-1,1))
ax.set_ylim((-1,1))
ax.set_xlabel('Real')
ax.set_ylabel('Imag')
ax.set_xticks([])
ax.set_yticks([])
ax.set_zticks([])
ax.set_autoscalez_on(True)#z轴自动缩放
ax.grid('on')
plt.show()
def cplxmap(z,cfun):
'''
Plot a function of a complex variable.
Parameters
----------
z: complex plane
cfun: complex function to plot
Returns
----------
None: Plot the surface of complex function
'''
blue = 0.2
x = np.real(z)
y = np.imag(z)
u = np.real(cfun)
v = np.imag(cfun)
M = np.max(np.max(u))#复变函数实部最大值
m = np.min(np.min(u))#复变函数实部最大值
s = np.ones(z.shape)
fig = plt.figure()
ax = fig.add_subplot(111,projection='3d')
# 投影部分用线框图
surf1 = ax.plot_wireframe(x,y,m*s,cmap=plt.cm.hsv)
surf2 = ax.plot_surface(x,y,u,cmap=plt.cm.hsv)
#绘制复变函数1/z时会出错,ValueError: Axis limits cannot be NaN or Inf
# ax.set_zlim(m, M)
ax.set_xlim((-1,1))
ax.set_ylim((-1,1))
ax.set_xlabel('Real')
ax.set_ylabel('Imag')
ax.set_xticks([])
ax.set_yticks([])
ax.set_zticks([])
ax.set_autoscalez_on(True)#z轴自动缩放
ax.grid('on')
plt.show()
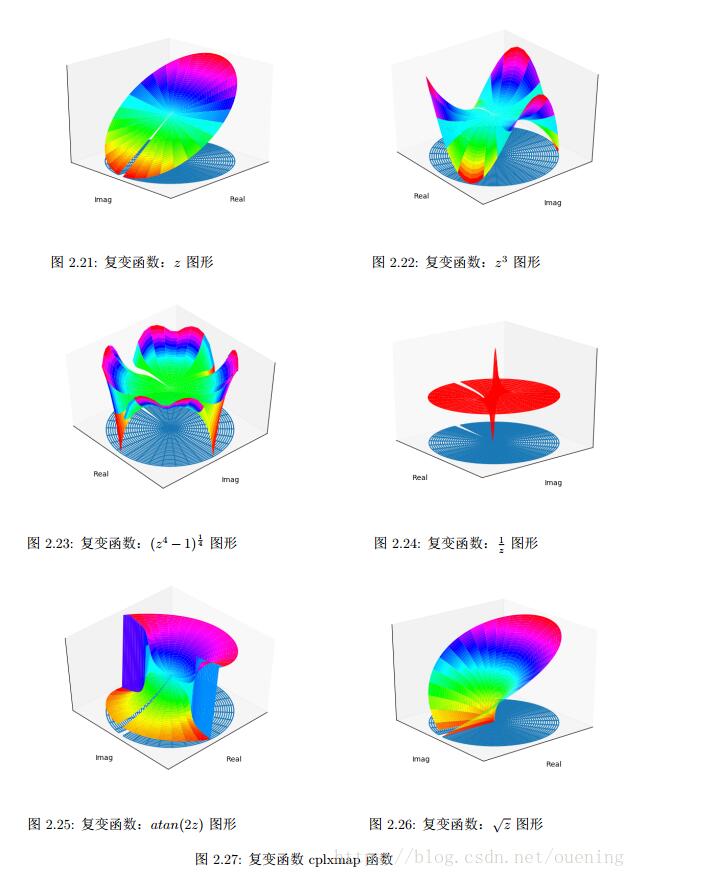
def _test_cplxmap():
'''测试cplxmap函数'''
z = cplxgrid(30)
w1 = z
w2 = z**3
w3 = (z**4-1)**(1/4)
w4 = 1/z
w5 = np.arctan(2*z)
w6 = np.sqrt(z)
w = [w1,w2,w3,w4,w5,w6]
for i in w:
cplxmap(z,i)
def _test_cplxroot():
'''测试cplxroot函数'''
cplxroot(n=2)
cplxroot(n=3)
cplxroot(n=4)
cplxroot(n=5)
if __name__ == '__main__':
_test_cplxmap()
_test_cplxroot()
以上这篇python/Matplotlib绘制复变函数图像教程就是小编分享给大家的全部内容了,希望能给大家一个参考,也希望大家多多支持【听图阁-专注于Python设计】。