python+matplotlib绘制饼图散点图实例代码
本文是从matplotlib官网上摘录下来的一个实例,实现的功能是Python+matplotlib绘制自定义饼图作为散点图的标记,具体如下。
首先看下演示效果
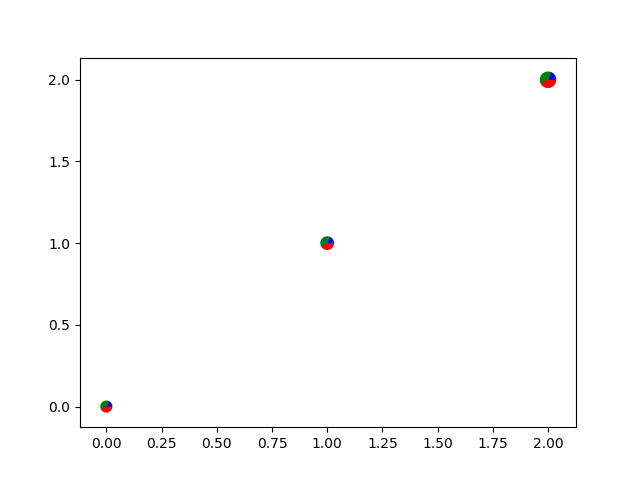
实例代码:
import numpy as np
import matplotlib.pyplot as plt

# first define the ratios
r1 = 0.2    # 20%
r2 = r1 + 0.4 # 40%

# define some sizes of the scatter marker
sizes = np.array([60, 80, 120])

# calculate the points of the first pie marker
#
# these are just the origin (0,0) +
# some points on a circle cos,sin
x = [0] + np.cos(np.linspace(0, 2 * np.pi * r1, 10)).tolist()
y = [0] + np.sin(np.linspace(0, 2 * np.pi * r1, 10)).tolist()
xy1 = list(zip(x, y))
s1 = np.max(xy1)

x = [0] + np.cos(np.linspace(2 * np.pi * r1, 2 * np.pi * r2, 10)).tolist()
y = [0] + np.sin(np.linspace(2 * np.pi * r1, 2 * np.pi * r2, 10)).tolist()
xy2 = list(zip(x, y))
s2 = np.max(xy2)

x = [0] + np.cos(np.linspace(2 * np.pi * r2, 2 * np.pi, 10)).tolist()
y = [0] + np.sin(np.linspace(2 * np.pi * r2, 2 * np.pi, 10)).tolist()
xy3 = list(zip(x, y))
s3 = np.max(xy3)

fig, ax = plt.subplots()
ax.scatter(range(3), range(3), marker=(xy1, 0),
      s=s1 ** 2 * sizes, facecolor='blue')
ax.scatter(range(3), range(3), marker=(xy2, 0),
      s=s2 ** 2 * sizes, facecolor='green')
ax.scatter(range(3), range(3), marker=(xy3, 0),
      s=s3 ** 2 * sizes, facecolor='red')

plt.show()
总结
以上就是本文关于python+matplotlib绘制饼图散点图实例代码的全部内容,希望对大家有所帮助。感兴趣的朋友可以继续参阅本站其他相关专题,如有不足之处,欢迎留言指出。感谢朋友们对本站的支持!