numpy.linspace函数具体使用详解
numpy.linspace(start, stop, num=50, endpoint=True, retstep=False, dtype=None)
在指定的间隔内返回均匀间隔的数字。
返回num均匀分布的样本,在[start, stop]。
这个区间的端点可以任意的被排除在外。
| Parameters(参数): |
start : scalar(标量)
stop : scalar
num : int, optional(可选)
endpoint : bool, optional
retstep : bool, optional
dtype : dtype, optional
|
|---|---|
| Returns: |
samples : ndarray
step : float(只有当retstep设置为真的时候才会存在)
|
See also
arange
Similar to linspace, but uses a step size (instead of the number of samples)
.arange使用的是步长,而不是样本的数量
logspace
Samples uniformly distributed in log space.
当endpoint被设置为False的时候
>>> import numpy as np
>>> np.linspace(1, 10, 10)
array([ 1.,  2.,  3.,  4.,  5.,  6.,  7.,  8.,  9., 10.])
>>> np.linspace(1, 10, 10, endpoint = False)
array([ 1. , 1.9, 2.8, 3.7, 4.6, 5.5, 6.4, 7.3, 8.2, 9.1])

In [4]: np.linspace(1, 10, 10, endpoint = False, retstep= True)
Out[4]: (array([ 1. , 1.9, 2.8, 3.7, 4.6, 5.5, 6.4, 7.3, 8.2, 9.1]), 0.9)
官网的例子
Examples
>>> >>> np.linspace(2.0, 3.0, num=5)
  array([ 2. , 2.25, 2.5 , 2.75, 3. ])
>>> np.linspace(2.0, 3.0, num=5, endpoint=False)
  array([ 2. , 2.2, 2.4, 2.6, 2.8])
>>> np.linspace(2.0, 3.0, num=5, retstep=True)
  (array([ 2. , 2.25, 2.5 , 2.75, 3. ]), 0.25)
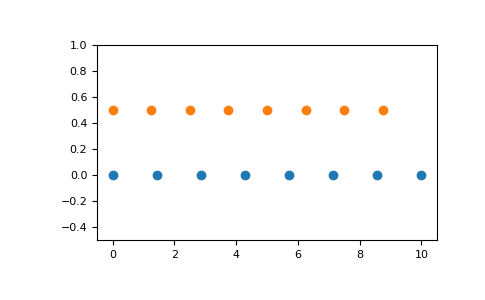
Graphical illustration:
>>> >>> import matplotlib.pyplot as plt
>>> N = 8
>>> y = np.zeros(N)
>>> x1 = np.linspace(0, 10, N, endpoint=True)
>>> x2 = np.linspace(0, 10, N, endpoint=False)
>>> plt.plot(x1, y, 'o')
[<matplotlib.lines.Line2D object at 0x...>]
>>> plt.plot(x2, y + 0.5, 'o')
[<matplotlib.lines.Line2D object at 0x...>]
>>> plt.ylim([-0.5, 1])
(-0.5, 1)
>>> plt.show()
以上就是本文的全部内容,希望对大家的学习有所帮助,也希望大家多多支持【听图阁-专注于Python设计】。