使用python的pandas为你的股票绘制趋势图
前言
手里有一点点公司的股票, 拿不准在什么时机抛售, 程序员也没时间天天盯着看,不如动手写个小程序, 把股票趋势每天早上发到邮箱里,用 python 的 pandas, matplotlib 写起来很容易, 几十行代码搞定。
准备环境
python3 -m venv venv
source ./venv/bin/activate
pip install pandas
pip install pandas_datareader
pip install matplotlib
代码如下
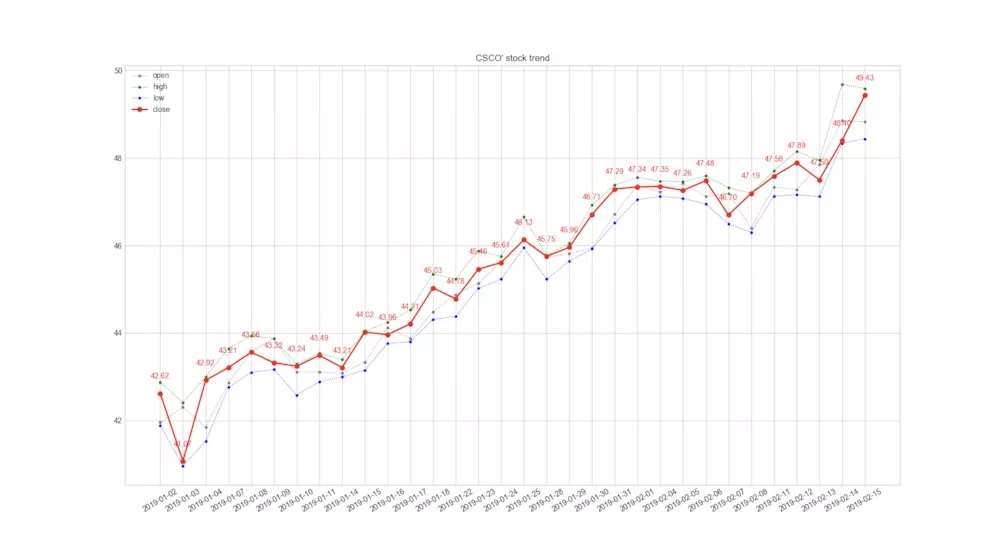
绘制 2019 年到今天2019-02-15 的我司 ( Cisco ) 的股票趋势 ( open:开盘价, close: 收盘价, high 最高价:, low: 最低价,单位为美元)
$ vi stock.py
import matplotlib.pyplot as plt
import pandas as pd
pd.core.common.is_list_like = pd.api.types.is_list_like
import pandas_datareader.data as web
import matplotlib
import time
import matplotlib.pyplot as plt
import argparse
def drawStockTrend(inc, startDate, endDate, pngFile):
fig = matplotlib.pyplot.gcf()
fig.set_size_inches(18.5, 10.5)
df = web.DataReader(name=inc, data_source='iex', start=startDate, end=endDate)
print(df)
plt.style.use('seaborn-whitegrid')
plt.xticks(rotation=30)
plt.plot(df.index, df['open'], label='open', marker='o', linestyle=':', linewidth=1, markersize=3, color='gray')
plt.plot(df.index, df['high'], label='high', marker='o', linestyle=':', linewidth=1, markersize=3, color='green')
plt.plot(df.index, df['low'], label='low', marker='o', linestyle=':', linewidth=1, markersize=3, color='blue')
plt.plot(df.index, df['close'], label='close', marker='o', linestyle='-', linewidth=2, markersize=6, color='red')
for x, y in zip(df.index, df['close']):
plt.text(x, y + 0.3, '%.2f' % y, ha='center', va='bottom', color='red')
plt.legend()
plt.title("%s' stock trend" % company)
plt.show(block=True)
time.sleep(1)
if(not pngFile):
fig.savefig(pngFile)
plt.close()
if __name__ == "__main__":
parser = argparse.ArgumentParser()
parser.add_argument('-c', action='store', dest='company', help='specify company')
parser.add_argument('-s', action='store', dest='start', help='specify start date')
parser.add_argument('-e', action='store', dest='end', help='specify end date')
parser.add_argument('-f', action='store', dest='file', help='specify the filename')
args = parser.parse_args()
company = 'CSCO'
startDate = '2019-01-01'
endDate = '2019-02-19'
pngFile = None
if(args.company):
company = args.company
if (args.start):
startDate = args.start
if (args.end):
endDate = args.end
if (args.file):
pngFile = args.file
drawStockTrend(company, startDate, endDate, pngFile)
#example
# python stock.py -c GOOGL -s 2019-01-01 -e 2019-02-19 -f google_stock_trend.png
# python stock.py -c CSCO -s 2019-01-01 -e 2019-02-19 -f cisco_stock_trend.png
# python stock.py -c SINA -s 2019-01-01 -e 2019-02-19 -f sina_stock_trend.png
# python stock.py -c BIDU -s 2019-01-01 -e 2019-02-19 -f baidu_stock_trend.png
# python stock.py -c NTES -s 2019-01-01 -e 2019-02-19 -f netease_stock_trend.png
运行命令如下
python stock.py -c CSCO -s 2019-01-01 -e 2019-02-19 -f cisco_stock_trend.png
图表如下
cisco
cisco
看来最近股价涨势不错。
再看看其他公司
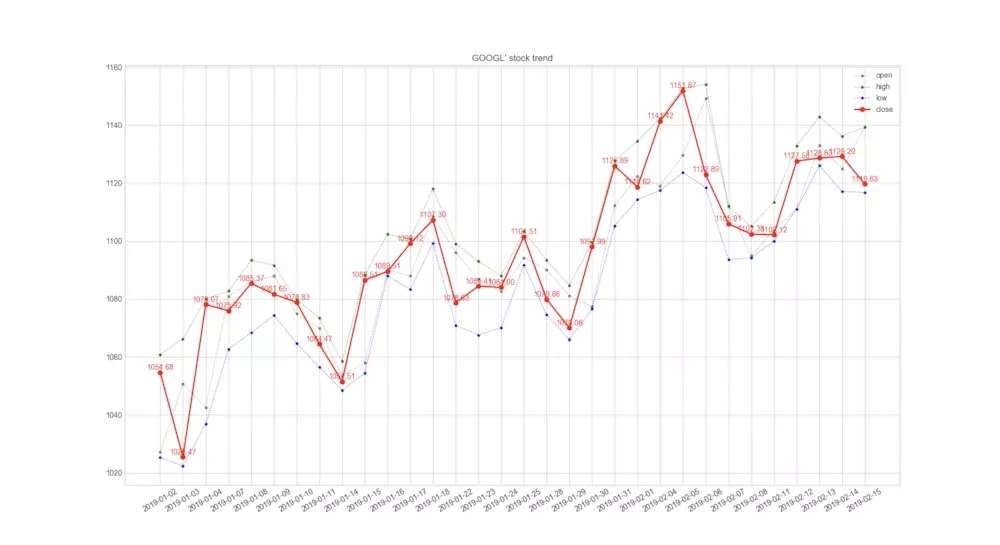
Baidu
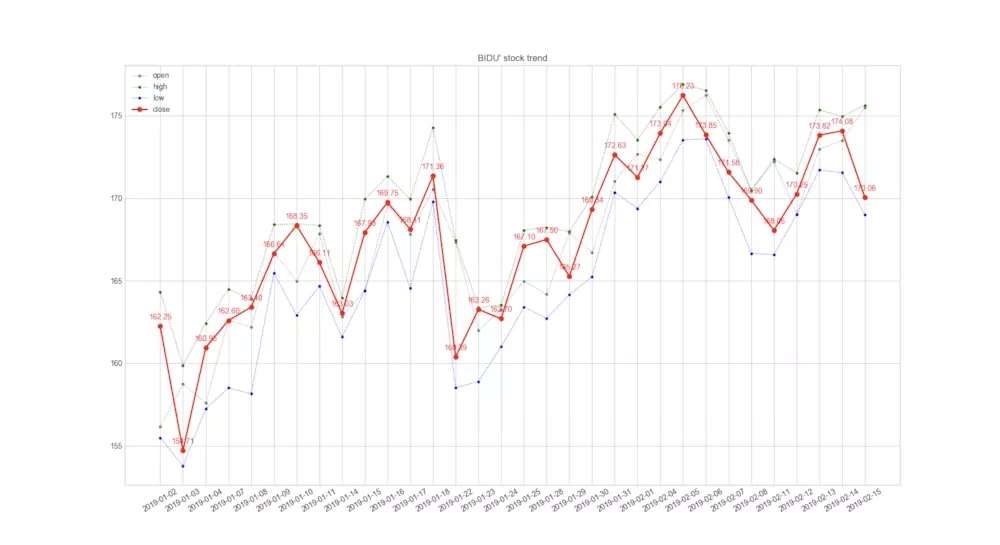
baidu
Netease
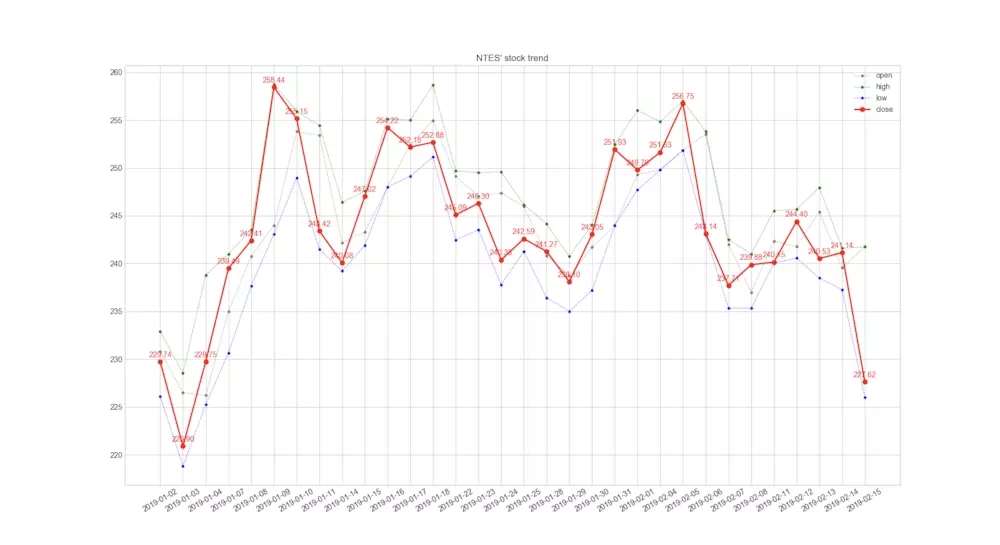
netease
以上就是本文的全部内容,希望对大家的学习有所帮助,也希望大家多多支持【听图阁-专注于Python设计】。