Python的matplotlib绘图如何修改背景颜色的实现
在主图中背景颜色不知道怎么改,plt.plot()中没有axisbg参数。
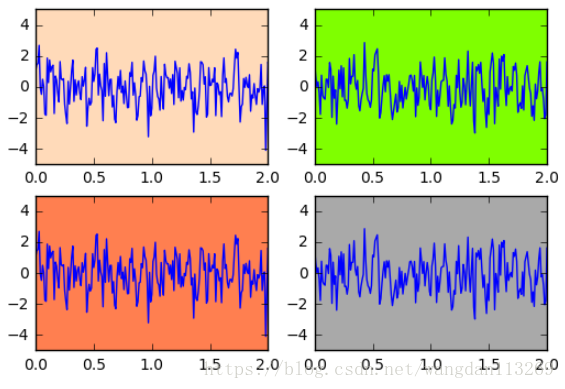
但是子图可以对plt.subplot的参数做修改,下面是对子图的背景颜色修改代码
import matplotlib.pyplot as plt
import numpy as np

# Fixing random state for reproducibility
np.random.seed(19680801)

dt = 0.01
t = np.arange(0, 30, dt)
nse1 = np.random.randn(len(t))         # white noise 1
nse2 = np.random.randn(len(t))         # white noise 2
s1 = np.sin(2 * np.pi * 10 * t) + nse1
s2 = np.sin(2 * np.pi * 10 * t) + nse2
s3 = np.sin(2 * np.pi * 10 * t) + nse1
s4 = np.sin(2 * np.pi * 10 * t) + nse2

fig= plt.figure(1) # 创建图表1
axs0=plt.subplot(221,axisbg='#FFDAB9') #在图标1中创建子图
axs0.plot(t, s1) #横轴与纵轴数据
axs0.set_xlim(0, 2) #限制x轴的取值范围
axs1=plt.subplot(222,axisbg='#7FFF00')
axs1.plot(t, s2)
axs1.set_xlim(0, 2)
axs2=plt.subplot(223,axisbg='#FF7F50')
axs2.plot(t, s3)
axs2.set_xlim(0, 2)
axs3=plt.subplot(224,axisbg='#A9A9A9')
axs3.plot(t, s4)
axs3.set_xlim(0, 2)

plt.show()
以上就是本文的全部内容,希望对大家的学习有所帮助,也希望大家多多支持【听图阁-专注于Python设计】。