python plotly绘制直方图实例详解
计算数值出现的次数
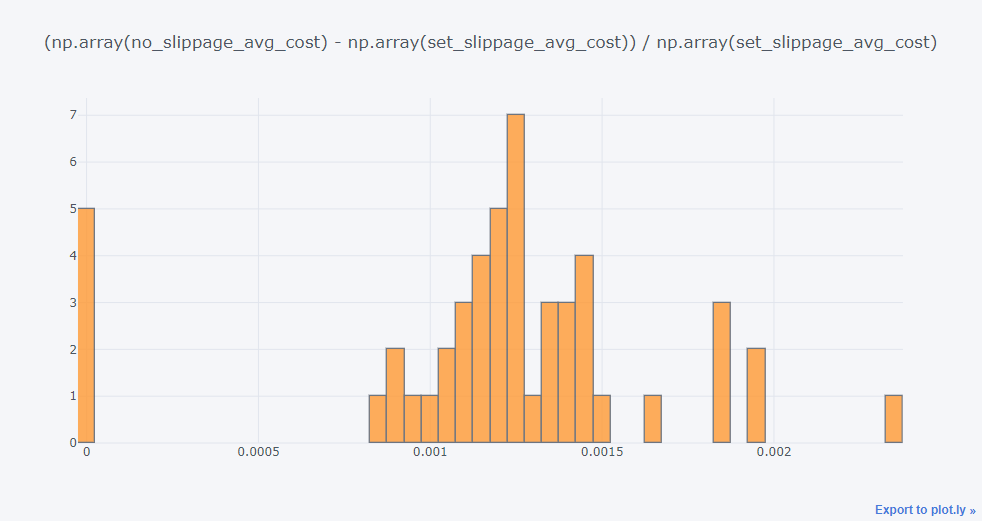
import cufflinks as cf
cf.go_offline()
import numpy as np
import pandas as pd

set_slippage_avg_cost = [22.01, 20.98, 17.11, 9.06, 9.4, 3.65, 19.65, 7.01, 11.21, 10.3, 5.1, 23.98, 12.03, 8.13, 8.07, 9.28, 3.93, 4.23, 18.6, 8.22, 7.85, 5.39, 29.4, 43.96, 6.12, 15.03, 2.68, 14.25, 7.9, 2.22, 15.74, 8.83, 8.18, 7.21, 30.38,25.46, 8.53, 8.05, 11.04, 24.95, 5.19, 6.8, 8.19, 5.44, 21.05, 7.06, 6.67, 18.61, 5.44, 2.9]

no_slippage_avg_cost = [22.04,21.01,17.13,9.07,9.41,3.65,19.67,7.02,11.22,10.31,5.11,24.01,12.04,8.14,8.08,9.29,3.93,4.24,18.62,8.23,7.86,5.4,29.44,44.01,6.13,15.05,2.68,14.27,7.91,2.22, 15.76, 8.84, 8.19, 7.22, 30.42, 25.49, 8.54, 8.06, 11.05, 24.98, 5.2, 6.81, 8.2, 5.45, 21.08, 7.07, 6.68,18.63,5.45,2.9]

diff = (np.array(no_slippage_avg_cost) - np.array(set_slippage_avg_cost)) / np.array(set_slippage_avg_cost)

pd.Series(diff).iplot(kind='histogram', bins=100, title='(np.array(no_slippage_avg_cost) - np.array(set_slippage_avg_cost)) / np.array(set_slippage_avg_cost)')
图


以上就是本文的全部内容,希望对大家的学习有所帮助,也希望大家多多支持【听图阁-专注于Python设计】。