自适应线性神经网络Adaline的python实现详解
自适应线性神经网络Adaptive linear network, 是神经网络的入门级别网络。
相对于感知器,采用了f(z)=z的激活函数,属于连续函数。
代价函数为LMS函数,最小均方算法,Least mean square。
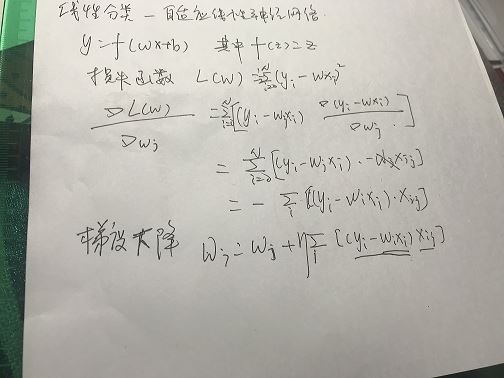
实现上,采用随机梯度下降,由于更新的随机性,运行多次结果是不同的。
'''
Adaline classifier
created on 2019.9.14
author: vince
'''
import pandas
import math
import numpy
import logging
import random
import matplotlib.pyplot as plt
from sklearn.datasets import load_iris
from sklearn.model_selection import train_test_split
from sklearn.metrics import accuracy_score
'''
Adaline classifier
Attributes
w: ld-array = weights after training
l: list = number of misclassification during each iteration
'''
class Adaline:
def __init__(self, eta = 0.001, iter_num = 500, batch_size = 1):
'''
eta: float = learning rate (between 0.0 and 1.0).
iter_num: int = iteration over the training dataset.
batch_size: int = gradient descent batch number,
if batch_size == 1, used SGD;
if batch_size == 0, use BGD;
else MBGD;
'''
self.eta = eta;
self.iter_num = iter_num;
self.batch_size = batch_size;
def train(self, X, Y):
'''
train training data.
X:{array-like}, shape=[n_samples, n_features] = Training vectors,
where n_samples is the number of training samples and
n_features is the number of features.
Y:{array-like}, share=[n_samples] = traget values.
'''
self.w = numpy.zeros(1 + X.shape[1]);
self.l = numpy.zeros(self.iter_num);
for iter_index in range(self.iter_num):
for rand_time in range(X.shape[0]):
sample_index = random.randint(0, X.shape[0] - 1);
if (self.activation(X[sample_index]) == Y[sample_index]):
continue;
output = self.net_input(X[sample_index]);
errors = Y[sample_index] - output;
self.w[0] += self.eta * errors;
self.w[1:] += self.eta * numpy.dot(errors, X[sample_index]);
break;
for sample_index in range(X.shape[0]):
self.l[iter_index] += (Y[sample_index] - self.net_input(X[sample_index])) ** 2 * 0.5;
logging.info("iter %s: w0(%s), w1(%s), w2(%s), l(%s)" %
(iter_index, self.w[0], self.w[1], self.w[2], self.l[iter_index]));
if iter_index > 1 and math.fabs(self.l[iter_index - 1] - self.l[iter_index]) < 0.0001:
break;
def activation(self, x):
return numpy.where(self.net_input(x) >= 0.0 , 1 , -1);
def net_input(self, x):
return numpy.dot(x, self.w[1:]) + self.w[0];
def predict(self, x):
return self.activation(x);
def main():
logging.basicConfig(level = logging.INFO,
format = '%(asctime)s %(filename)s[line:%(lineno)d] %(levelname)s %(message)s',
datefmt = '%a, %d %b %Y %H:%M:%S');
iris = load_iris();
features = iris.data[:99, [0, 2]];
# normalization
features_std = numpy.copy(features);
for i in range(features.shape[1]):
features_std[:, i] = (features_std[:, i] - features[:, i].mean()) / features[:, i].std();
labels = numpy.where(iris.target[:99] == 0, -1, 1);
# 2/3 data from training, 1/3 data for testing
train_features, test_features, train_labels, test_labels = train_test_split(
features_std, labels, test_size = 0.33, random_state = 23323);
logging.info("train set shape:%s" % (str(train_features.shape)));
classifier = Adaline();
classifier.train(train_features, train_labels);
test_predict = numpy.array([]);
for feature in test_features:
predict_label = classifier.predict(feature);
test_predict = numpy.append(test_predict, predict_label);
score = accuracy_score(test_labels, test_predict);
logging.info("The accruacy score is: %s "% (str(score)));
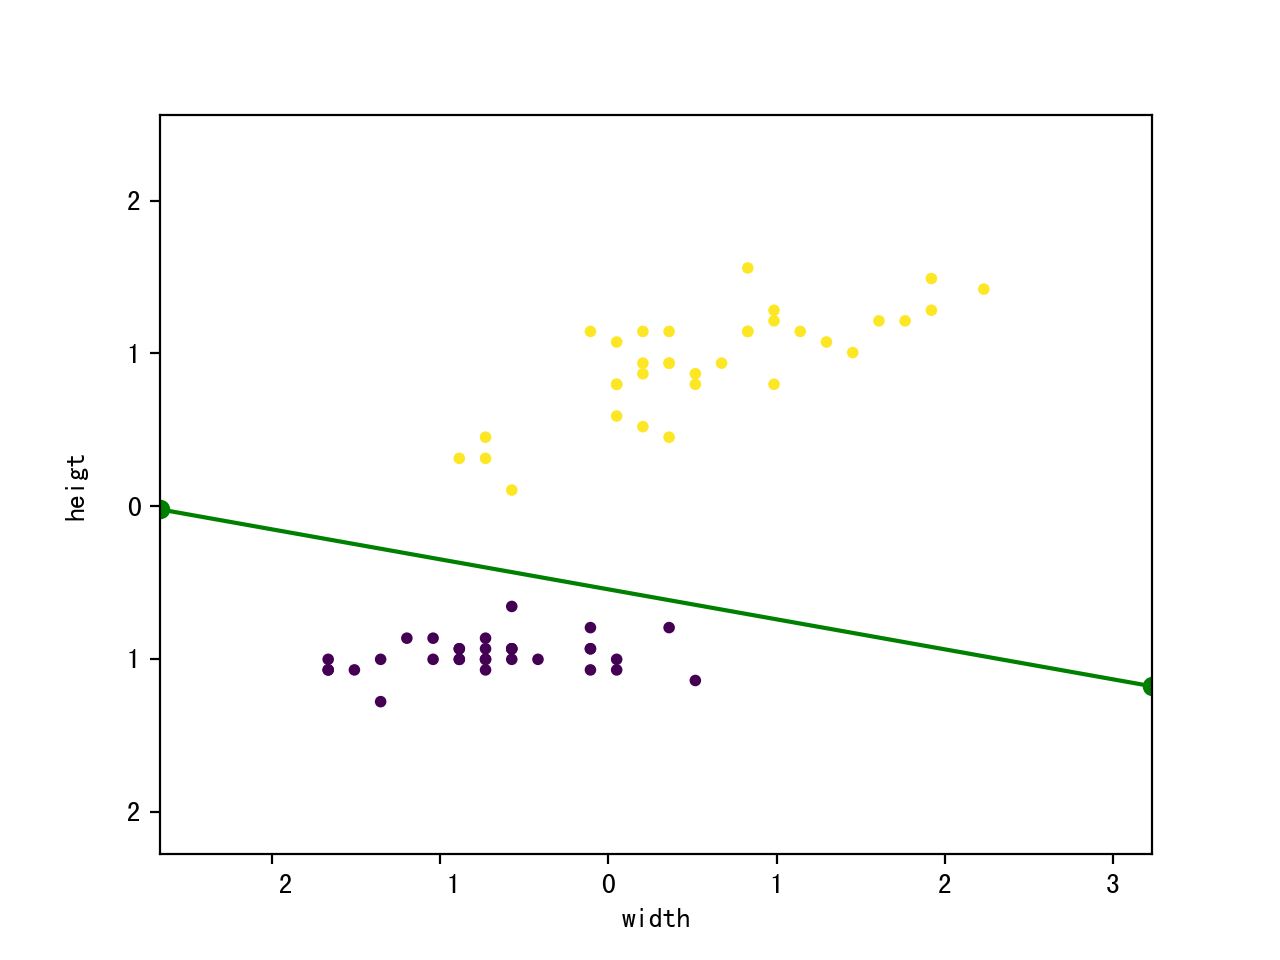
#plot
x_min, x_max = train_features[:, 0].min() - 1, train_features[:, 0].max() + 1;
y_min, y_max = train_features[:, 1].min() - 1, train_features[:, 1].max() + 1;
plt.xlim(x_min, x_max);
plt.ylim(y_min, y_max);
plt.xlabel("width");
plt.ylabel("heigt");
plt.scatter(train_features[:, 0], train_features[:, 1], c = train_labels, marker = 'o', s = 10);
k = - classifier.w[1] / classifier.w[2];
d = - classifier.w[0] / classifier.w[2];
plt.plot([x_min, x_max], [k * x_min + d, k * x_max + d], "go-");
plt.show();
if __name__ == "__main__":
main();
以上就是本文的全部内容,希望对大家的学习有所帮助,也希望大家多多支持【听图阁-专注于Python设计】。