python构建指数平滑预测模型示例
指数平滑法
其实我想说自己百度的…
只有懂的人才会找到这篇文章…
不懂的人…看了我的文章…还是不懂哈哈哈
指数平滑法相比于移动平均法,它是一种特殊的加权平均方法。简单移动平均法用的是算术平均数,近期数据对预测值的影响比远期数据要大一些,而且越近的数据影响越大。指数平滑法正是考虑了这一点,并将其权值按指数递减的规律进行分配,越接近当前的数据,权重越大;反之,远离当前的数据,其权重越小。指数平滑法按照平滑的次数,一般可分为一次指数平滑法、二次指数平滑法和三次指数平滑法等。然而一次指数平滑法适用于无趋势效应、呈平滑趋势的时间序列的预测和分析,二次指数平滑法多适用于呈线性变化的时间序列预测。
具体公式还是百度吧…
材料
1.python3.5
2.numpy
3.matplotlib
4.国家社科基金1995-2015年立项数据
需求
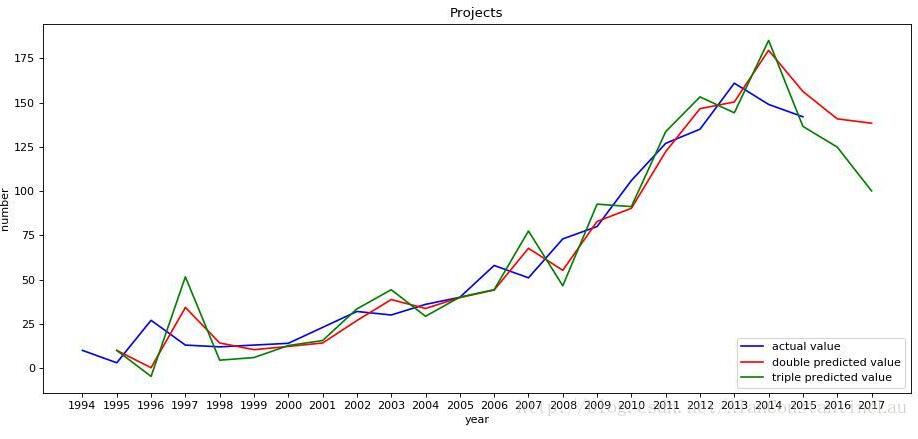
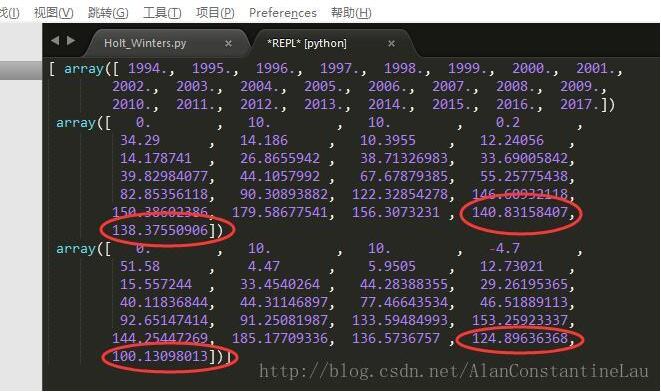
预测2016年和2017年国家社科基金项目立项数量
数据
#year time_id number
1994 1 10
1995 2 3
1996 3 27
1997 4 13
1998 5 12
1999 6 13
2000 7 14
2001 8 23
2002 9 32
2003 10 30
2004 11 36
2005 12 40
2006 13 58
2007 14 51
2008 15 73
2009 16 80
2010 17 106
2011 18 127
2012 19 135
2013 20 161
2014 21 149
2015 22 142
代码
# -*- coding: utf-8 -*-
# @Date  : 2017-04-11 21:27:00
# @Author : Alan Lau (rlalan@outlook.com)
# @Language : Python3.5

import numpy as np
from matplotlib import pyplot as plt

#指数平滑公式
def exponential_smoothing(alpha, s):
 s2 = np.zeros(s.shape)
 s2[0] = s[0]
 for i in range(1, len(s2)):
  s2[i] = alpha*s[i]+(1-alpha)*s2[i-1]
 return s2

#绘制预测曲线
def show_data(new_year, pre_year, data, s_pre_double, s_pre_triple):
 year, time_id, number = data.T

 plt.figure(figsize=(14, 6), dpi=80)#设置绘图区域的大小和像素
 plt.plot(year, number, color='blue', label="actual value")#将实际值的折线设置为蓝色
 plt.plot(new_year[1:], s_pre_double[2:],color='red', label="double predicted value")#将二次指数平滑法计算的预测值的折线设置为红色
 plt.plot(new_year[1:], s_pre_triple[2:],color='green', label="triple predicted value")#将三次指数平滑法计算的预测值的折线设置为绿色
 plt.legend(loc='lower right')#显示图例的位置,这里为右下方
 plt.title('Projects')
 plt.xlabel('year')#x轴标签
 plt.ylabel('number')#y轴标签
 plt.xticks(new_year)#设置x轴的刻度线为new_year
 plt.show()


def main():
 alpha = .70#设置alphe,即平滑系数
 pre_year = np.array([2016, 2017])#将需要预测的两年存入numpy的array对象里
 data_path = r'data1.txt'#设置数据路径
 data = np.loadtxt(data_path)#用numpy读取数据
 year, time_id, number = data.T#将数据分别赋值给year, time_id, number
 initial_line = np.array([0, 0, number[0]])#初始化,由于平滑指数是根据上一期的数值进行预测的,原始数据中的最早数据为1995,没有1994年的数据,这里定义1994年的数据和1995年数据相同
 initial_data = np.insert(data, 0, values=initial_line, axis=0)#插入初始化数据
 initial_year, initial_time_id, initial_number = initial_data.T#插入初始化年

 s_single = exponential_smoothing(alpha, initial_number)#计算一次指数平滑
 s_double = exponential_smoothing(alpha, s_single)#计算二次平滑字数,二次平滑指数是在一次指数平滑的基础上进行的,三次指数平滑以此类推

 a_double = 2*s_single-s_double#计算二次指数平滑的a
 b_double = (alpha/(1-alpha))*(s_single-s_double)#计算二次指数平滑的b
 s_pre_double = np.zeros(s_double.shape)#建立预测轴
 for i in range(1, len(initial_time_id)):
  s_pre_double[i] = a_double[i-1]+b_double[i-1]#循环计算每一年的二次指数平滑法的预测值,下面三次指数平滑法原理相同
 pre_next_year = a_double[-1]+b_double[-1]*1#预测下一年
 pre_next_two_year = a_double[-1]+b_double[-1]*2#预测下两年
 insert_year = np.array([pre_next_year, pre_next_two_year])
 s_pre_double = np.insert(s_pre_double, len(s_pre_double), values=np.array([pre_next_year, pre_next_two_year]), axis=0)#组合预测值

 s_triple = exponential_smoothing(alpha, s_double)

 a_triple = 3*s_single-3*s_double+s_triple
 b_triple = (alpha/(2*((1-alpha)**2)))*((6-5*alpha)*s_single -2*((5-4*alpha)*s_double)+(4-3*alpha)*s_triple)
 c_triple = ((alpha**2)/(2*((1-alpha)**2)))*(s_single-2*s_double+s_triple)

 s_pre_triple = np.zeros(s_triple.shape)

 for i in range(1, len(initial_time_id)):
  s_pre_triple[i] = a_triple[i-1]+b_triple[i-1]*1 + c_triple[i-1]*(1**2)

 pre_next_year = a_triple[-1]+b_triple[-1]*1 + c_triple[-1]*(1**2)
 pre_next_two_year = a_triple[-1]+b_triple[-1]*2 + c_triple[-1]*(2**2)
 insert_year = np.array([pre_next_year, pre_next_two_year])
 s_pre_triple = np.insert(s_pre_triple, len(s_pre_triple), values=np.array([pre_next_year, pre_next_two_year]), axis=0)

 new_year = np.insert(year, len(year), values=pre_year, axis=0)
 output = np.array([new_year, s_pre_double, s_pre_triple])
 print(output)
 show_data(new_year, pre_year, data, s_pre_double, s_pre_triple)#传入预测值和数据


if __name__ == '__main__':
 main()
预测结果
以上这篇python构建指数平滑预测模型示例就是小编分享给大家的全部内容了,希望能给大家一个参考,也希望大家多多支持【听图阁-专注于Python设计】。