matplotlib在python上绘制3D散点图实例详解
大家可以先参考官方演示文档:
效果图:
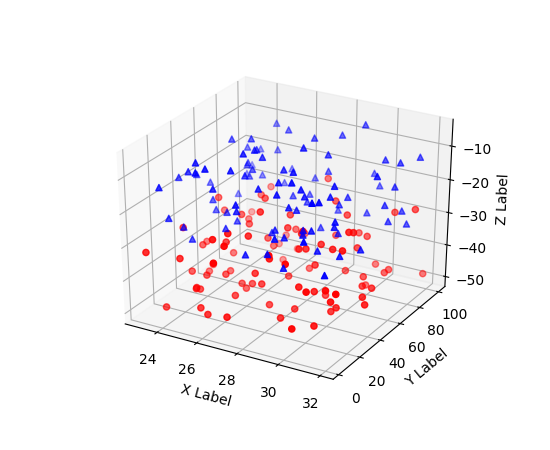
'''
==============
3D scatterplot
==============
Demonstration of a basic scatterplot in 3D.
'''
from mpl_toolkits.mplot3d import Axes3D
import matplotlib.pyplot as plt
import numpy as np

def randrange(n, vmin, vmax):
 '''
 Helper function to make an array of random numbers having shape (n, )
 with each number distributed Uniform(vmin, vmax).
 '''
 return (vmax - vmin)*np.random.rand(n) + vmin

fig = plt.figure()
ax = fig.add_subplot(111, projection='3d')

n = 100

# For each set of style and range settings, plot n random points in the box
# defined by x in [23, 32], y in [0, 100], z in [zlow, zhigh].
for c, m, zlow, zhigh in [('r', 'o', -50, -25), ('b', '^', -30, -5)]:
 xs = randrange(n, 23, 32)
 ys = randrange(n, 0, 100)
 zs = randrange(n, zlow, zhigh)
 ax.scatter(xs, ys, zs, c=c, marker=m)

ax.set_xlabel('X Label')
ax.set_ylabel('Y Label')
ax.set_zlabel('Z Label')

plt.show()
以上是官网上的代码示例及演示结果,下面分享下本文代码示例。
本实例需要导入第三包:
import matplotlib.pyplot as plt
from mpl_toolkits.mplot3d import Axes3D
然后绘图:
ax = plt.figure().add_subplot(111, projection = '3d')
#基于ax变量绘制三维图
#xs表示x方向的变量
#ys表示y方向的变量
#zs表示z方向的变量,这三个方向上的变量都可以用list的形式表示
#m表示点的形式,o是圆形的点,^是三角形(marker)
#c表示颜色(color for short)
ax.scatter(xs, ys, zs, c = 'r', marker = '^') #点为红色三角形

#设置坐标轴
ax.set_xlabel('X Label')
ax.set_ylabel('Y Label')
ax.set_zlabel('Z Label')

#显示图像
plt.show()
注:
上面的
ax = plt.figure().add_subplot(111, projection = '3d')
是下面代码的略写
fig = plt.figure()
ax = fig.add_subplot(111, projection = '3d')
总结
以上就是本文关于matplotlib在python上绘制3D散点图实例详解的全部内容,希望对大家有所帮助。感兴趣的朋友可以继续参阅本站其他相关专题,如有不足之处,欢迎留言指出。感谢朋友们对本站的支持!