python绘制条形图方法代码详解
1.首先要绘制一个简单的条形图
import numpy as np
import matplotlib.pyplot as plt
from matplotlib import mlab
from matplotlib import rcParams
fig1 = plt.figure(2)
rects =plt.bar(left = (0.2,1),height = (1,0.5),width = 0.2,align="center",yerr=0.000001)
plt.title('Pe')
plt.show()
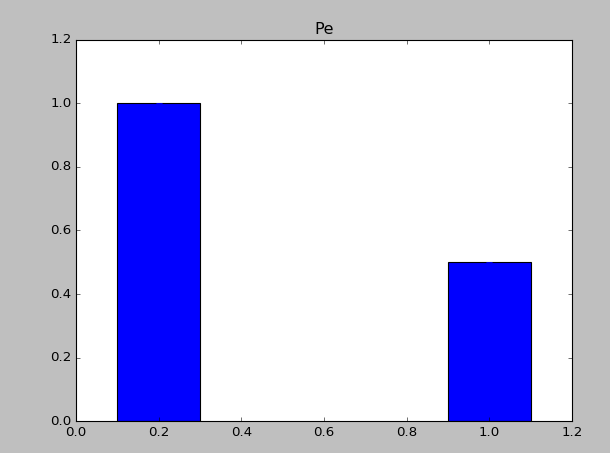
1.1上面中rects=plt.bar(left=(0.2,1),height=(1,0.5),width=0.2,align=”center”,yerr=0.000001)这句代码是最重要的,其中left表示直方图的开始的位置(也就是最左边的地方),height是指直方图的高度,当直方图太粗时,可以通过width来定义直方图的宽度,注意多个直方图要用元组,yerr这个参数是防止直方图触顶。
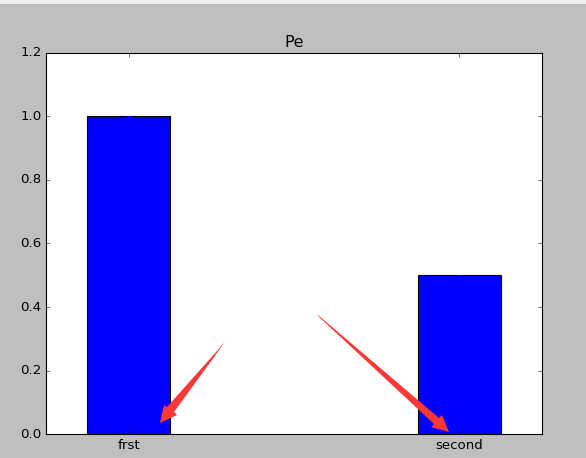
2.增加直方图脚注
import numpy as np
import matplotlib.pyplot as plt
from matplotlib import mlab
from matplotlib import rcParams
fig1 = plt.figure(2)
rects =plt.bar(left = (0.2,1),height = (1,0.5),width = 0.2,align="center",yerr=0.000001)
plt.title('Pe')
plt.xticks((0.2,1),('frst','second'))
plt.show()
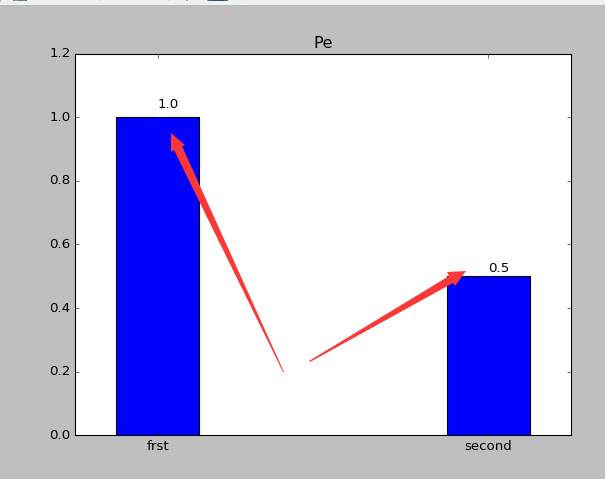
3.条形图上显示具体的数字(自动编号)
import numpy as np
import matplotlib.pyplot as plt
from matplotlib import mlab
from matplotlib import rcParams
fig1 = plt.figure(2)
rects =plt.bar(left = (0.2,1),height = (1,0.5),width = 0.2,align="center",yerr=0.000001)
plt.title('Pe')
def autolabel(rects):
  for rect in rects:
    height = rect.get_height()
    plt.text(rect.get_x()+rect.get_width()/2., 1.03*height, '%s' % float(height))
autolabel(rects)
plt.xticks((0.2,1),('frst','second'))
plt.show()
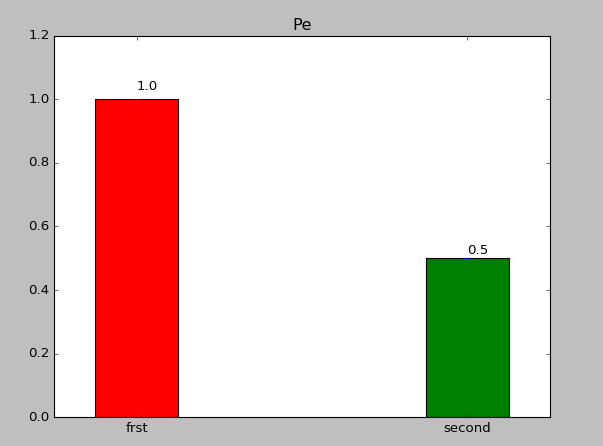
4.改变颜色
import numpy as np
import matplotlib.pyplot as plt
from matplotlib import mlab
from matplotlib import rcParams
fig1 = plt.figure(2)
rects =plt.bar(left = (0.2,1),height = (1,0.5),color=('r','g'),width = 0.2,align="center",yerr=0.000001)
plt.title('Pe')
def autolabel(rects):
  for rect in rects:
    height = rect.get_height()
    plt.text(rect.get_x()+rect.get_width()/2., 1.03*height, '%s' % float(height))
autolabel(rects)
plt.xticks((0.2,1),('frst','second'))
plt.show()
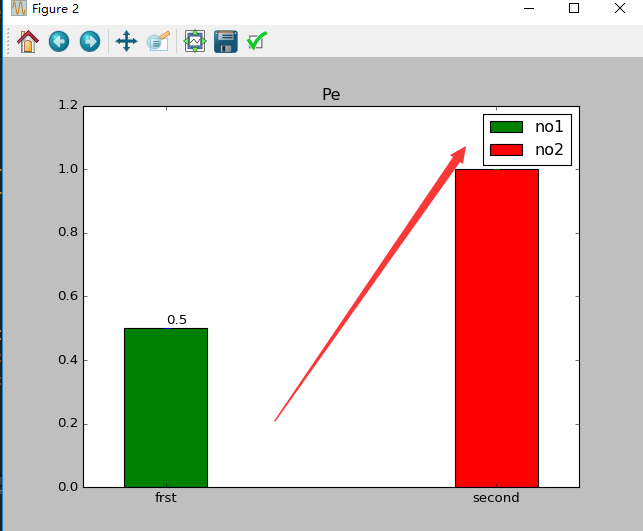
5.添加图注
import numpy as np
import matplotlib.pyplot as plt
from matplotlib import mlab
from matplotlib import rcParams
fig1 = plt.figure(2)
rects1 =plt.bar(left = (0.2),height = (0.5),color=('g'),label=(('no1')),width = 0.2,align="center",yerr=0.000001)
rects2 =plt.bar(left = (1),height = (1),color=('r'),label=(('no2')),width = 0.2,align="center",yerr=0.000001)
plt.legend()
plt.xticks((0.2,1),('frst','second'))
plt.title('Pe')

def autolabel(rects):
  for rect in rects:
    height = rect.get_height()
    plt.text(rect.get_x()+rect.get_width()/2., 1.03*height, '%s' % float(height))
autolabel(rects1)
autolabel(rects2)
plt.show()
6大家根据自己的需要自己来绘制自己的条形图
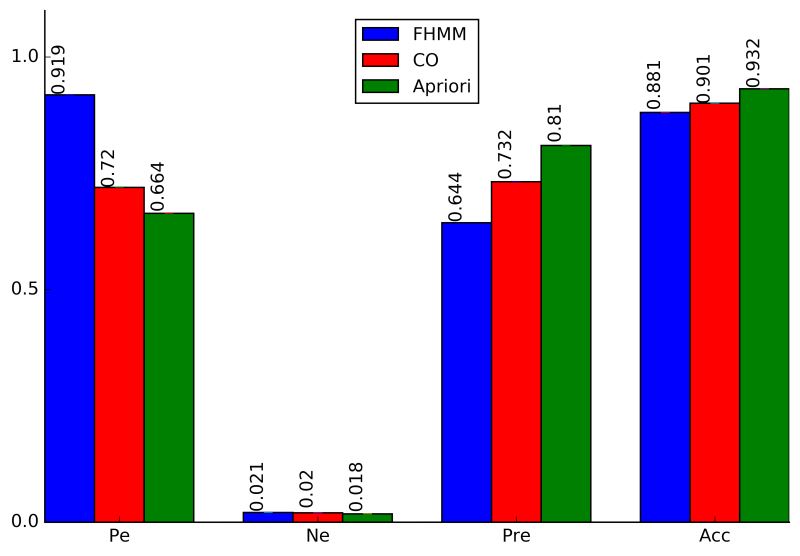
下面回答网友提问,如何画在条形图上垂直显示数据:
下面这个函数是用来垂直显示的,其中设置角度就可以以任意方式来显示。
def autolabel(rects,Num=1.12,rotation1=90,NN=1):
    for rect in rects:
      height = rect.get_height()
      plt.text(rect.get_x()-0.04+rect.get_width()/2., Num*height, '%s' % float(height*NN),rotation=rotation1)
调用方式如下
rects1 =plt.bar(left = (0.05),height = (Pe_FH),color=('b'),label=('FHMM'),width = 0.1,align="center",yerr=0.000001);
autolabel(rects1,1.09);
下面是效果图
总结
以上就是本文关于python绘制条形图方法代码详解的全部内容,希望对大家有所帮助。感兴趣的朋友可以继续参考本站:
如有不足之处,欢迎留言指出。感谢朋友们对本站的支持!