Python+matplotlib+numpy实现在不同平面的二维条形图
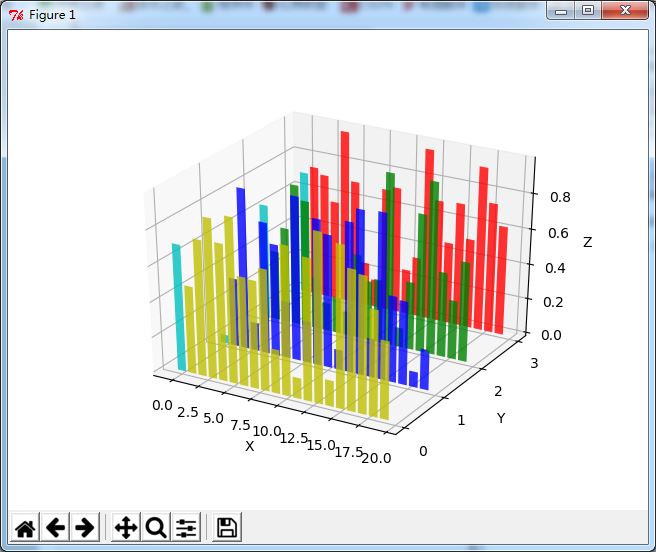
在不同平面上绘制二维条形图。
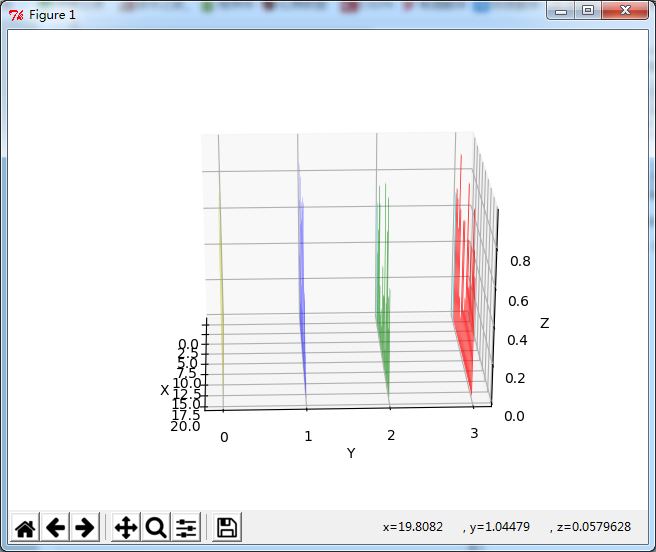
本实例制作了一个3d图,其中有二维条形图投射到平面y=0,y=1,等。
演示结果:


完整代码:
from mpl_toolkits.mplot3d import Axes3D
import matplotlib.pyplot as plt
import numpy as np

# Fixing random state for reproducibility
np.random.seed(19680801)


fig = plt.figure()
ax = fig.add_subplot(111, projection='3d')

colors = ['r', 'g', 'b', 'y']
yticks = [3, 2, 1, 0]
for c, k in zip(colors, yticks):
  # Generate the random data for the y=k 'layer'.
  xs = np.arange(20)
  ys = np.random.rand(20)

  # You can provide either a single color or an array with the same length as
  # xs and ys. To demonstrate this, we color the first bar of each set cyan.
  cs = [c] * len(xs)
  cs[0] = 'c'

  # Plot the bar graph given by xs and ys on the plane y=k with 80% opacity.
  ax.bar(xs, ys, zs=k, zdir='y', color=cs, alpha=0.8)

ax.set_xlabel('X')
ax.set_ylabel('Y')
ax.set_zlabel('Z')

# On the y axis let's only label the discrete values that we have data for.
ax.set_yticks(yticks)

plt.show()
脚本运行时间:(0分0.063秒)
总结
以上就是本文关于Python+matplotlib+numpy实现在不同平面的二维条形图的全部内容,希望对大家有所帮助。感兴趣的朋友可以继续参阅本站其他相关专题,如有不足之处,欢迎留言指出。感谢朋友们对本站的支持!

