Python模拟脉冲星伪信号频率实例代码
脉冲星假信号频率的相对路径论证。
首先看一下演示结果:
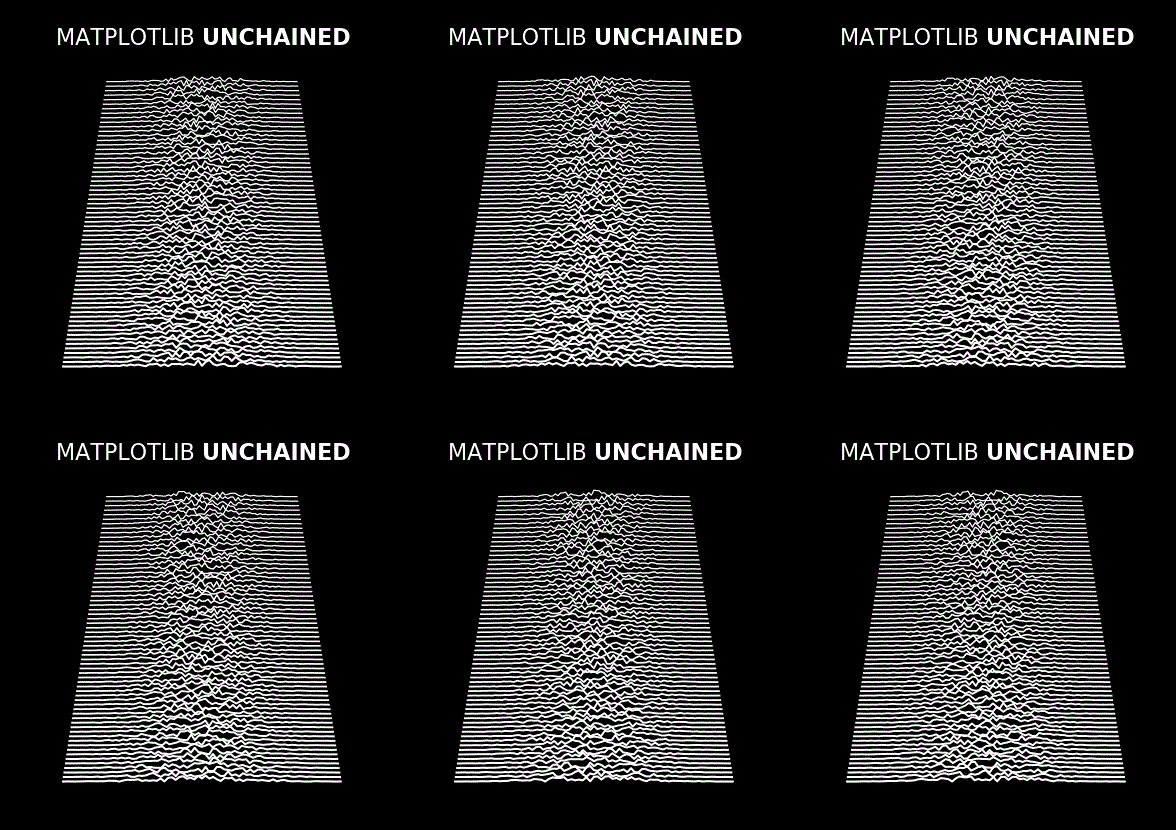
实例代码:
import numpy as np
import matplotlib.pyplot as plt
import matplotlib.animation as animation

# Fixing random state for reproducibility
np.random.seed(19680801)


# Create new Figure with black background
fig = plt.figure(figsize=(8, 8), facecolor='black')

# Add a subplot with no frame
ax = plt.subplot(111, frameon=False)

# Generate random data
data = np.random.uniform(0, 1, (64, 75))
X = np.linspace(-1, 1, data.shape[-1])
G = 1.5 * np.exp(-4 * X ** 2)

# Generate line plots
lines = []
for i in range(len(data)):
  # Small reduction of the X extents to get a cheap perspective effect
  xscale = 1 - i / 200.
  # Same for linewidth (thicker strokes on bottom)
  lw = 1.5 - i / 100.0
  line, = ax.plot(xscale * X, i + G * data[i], color="w", lw=lw)
  lines.append(line)

# Set y limit (or first line is cropped because of thickness)
ax.set_ylim(-1, 70)

# No ticks
ax.set_xticks([])
ax.set_yticks([])

# 2 part titles to get different font weights
ax.text(0.5, 1.0, "MATPLOTLIB ", transform=ax.transAxes,
    ha="right", va="bottom", color="w",
    family="sans-serif", fontweight="light", fontsize=16)
ax.text(0.5, 1.0, "UNCHAINED", transform=ax.transAxes,
    ha="left", va="bottom", color="w",
    family="sans-serif", fontweight="bold", fontsize=16)


def update(*args):
  # Shift all data to the right
  data[:, 1:] = data[:, :-1]

  # Fill-in new values
  data[:, 0] = np.random.uniform(0, 1, len(data))

  # Update data
  for i in range(len(data)):
    lines[i].set_ydata(i + G * data[i])

  # Return modified artists
  return lines

# Construct the animation, using the update function as the animation
# director.
anim = animation.FuncAnimation(fig, update, interval=10)
plt.show()
脚本运行时间:(0分0.065秒)
总结
以上就是本文关于Python模拟脉冲星伪信号频率实例代码的全部内容,希望对大家有所帮助。感兴趣的朋友可以继续参阅本站其他相关专题,如有不足之处,欢迎留言指出。感谢朋友们对本站的支持!