matplotlib作图添加表格实例代码
本文所示代码主要是通过Python+matplotlib实现作图,并且在图中添加表格的功能,具体如下。
代码
import matplotlib.pyplot as plt
import numpy as np

plt.figure()
ax = plt.gca()
y = np.random.randn(9)

col_labels = ['col1','col2','col3']
row_labels = ['row1','row2','row3']
table_vals = [[11,12,13],[21,22,23],[28,29,30]]
row_colors = ['red','gold','green']
my_table = plt.table(cellText=table_vals, colWidths=[0.1]*3,
   rowLabels=row_labels, colLabels=col_labels,
   rowColours=row_colors, colColours=row_colors,
   loc='best')
plt.plot(y)

plt.show()
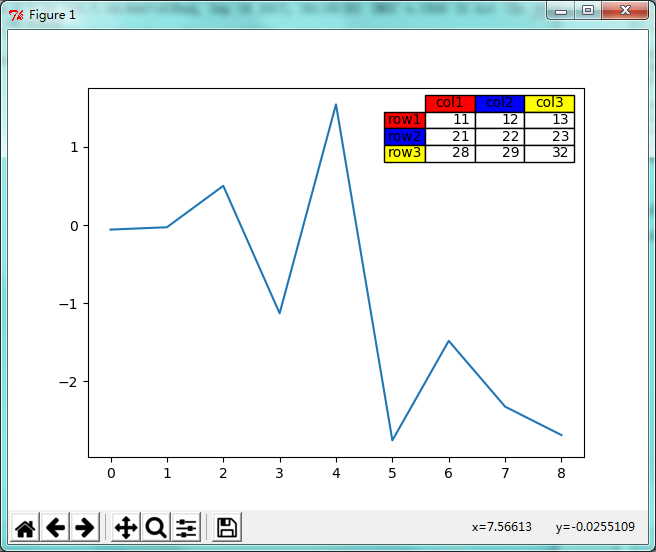
演示

代码测试有效,大家可以放心参考。
总结
以上就是本文关于matplotlib作图添加表格实例代码的全部内容,希望对大家有所帮助。感兴趣的朋友可以继续参阅本站其他相关专题,如有不足之处,欢迎留言指出。感谢朋友们对本站的支持!

