matplotlib给子图添加图例的方法

yipeiwu_com6年前Python基础

代码如下:

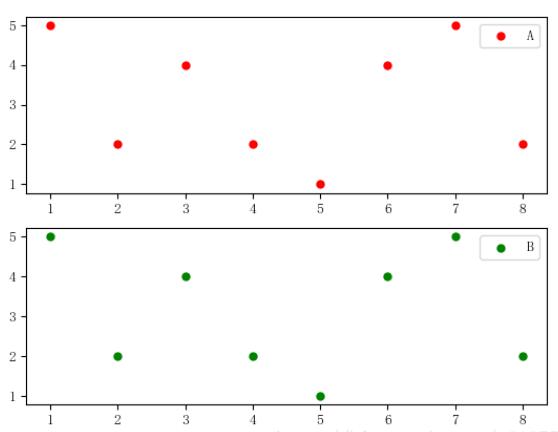
import matplotlib.pyplot as plt

x = [1,2,3,4,5,6,7,8]
y = [5,2,4,2,1,4,5,2]
axe1 = plt.subplot(211)
s1 = axe1.scatter(x,y, color='r', s=25, marker="o")
plt.legend([s1],['A'])
#或者
#s1 = axe1.scatter(x,y, color='r', s=25, marker="o", label='A')
#plt.legend()

axe2 = plt.subplot(212)
s2 = axe2.scatter(x,y, color='g', s=25, marker="o")
plt.legend([s2],['B'])
#或者
#s2 = axe1.scatter(x,y, color='r', s=25, marker="o", label='B')
#plt.legend()
plt.show()

效果图如下:

以上这篇matplotlib给子图添加图例的方法就是小编分享给大家的全部内容了,希望能给大家一个参考,也希望大家多多支持【听图阁-专注于Python设计】。

相关文章

python实现图书借阅系统

本文实例为大家分享了python实现图书借阅系统的具体代码,供大家参考,具体内容如下 部分代码: from flask import Flask,render_template fr...

Django中实现一个高性能计数器(Counter)实例

计数器(Counter)是一个非常常用的功能组件,这篇blog以未读消息数为例,介绍了在 Django中实现一个高性能计数器的基本要点。 故事的开始:.count() 假设你有一个Not...

解决Python内层for循环如何break出外层的循环的问题

偶然发现了for…else…这种用法,使用这个实现了break跳出嵌套的for循环 In [31]: for i in range(1,5): ...: for j in r...

Python给定一个句子倒序输出单词以及字母的方法

如下所示: #!/usr/bin/python # -*- coding: utf-8 -*- def rever(sentence): newwords = [] word...

python解析中国天气网的天气数据

使用方法:terminal中输入复制代码 代码如下:python weather.py http://www.weather.com.cn/weather/101010100.shtml...