Python实现的逻辑回归算法示例【附测试csv文件下载】
本文实例讲述了Python实现的逻辑回归算法。分享给大家供大家参考,具体如下:
使用python实现逻辑回归
Using Python to Implement Logistic Regression Algorithm
菜鸟写的逻辑回归,记录一下学习过程
代码:
#encoding:utf-8
"""
Author: njulpy
Version: 1.0
Data: 2018/04/10
Project: Using Python to Implement LogisticRegression Algorithm
"""
import numpy as np
import pandas as pd
import matplotlib.pyplot as plt
from sklearn.model_selection import train_test_split
#建立sigmoid函数
def sigmoid(x):
x = x.astype(float)
return 1./(1+np.exp(-x))
#训练模型,采用梯度下降算法
def train(x_train,y_train,num,alpha,m,n):
beta = np.ones(n)
for i in range(num):
h=sigmoid(np.dot(x_train,beta)) #计算预测值
error = h-y_train.T #计算预测值与训练集的差值
delt=alpha*(np.dot(error,x_train))/m #计算参数的梯度变化值
beta = beta - delt
#print('error',error)
return beta
def predict(x_test,beta):
y_predict=np.zeros(len(y_test))+0.5
s=sigmoid(np.dot(beta,x_test.T))
y_predict[s < 0.34] = 0
y_predict[s > 0.67] = 1
return y_predict
def accurancy(y_predict,y_test):
acc=1-np.sum(np.absolute(y_predict-y_test))/len(y_test)
return acc
if __name__ == "__main__":
data = pd.read_csv('iris.csv')
x = data.iloc[:,1:5]
y = data.iloc[:,5].copy()
y.loc[y== 'setosa'] = 0
y.loc[y== 'versicolor'] = 0.5
y.loc[y== 'virginica'] = 1
x_train,x_test,y_train,y_test = train_test_split(x,y,test_size=0.3,random_state=15)
m,n=np.shape(x_train)
alpha = 0.01
beta=train(x_train,y_train,1000,alpha,m,n)
pre=predict(x_test,beta)
t = np.arange(len(x_test))
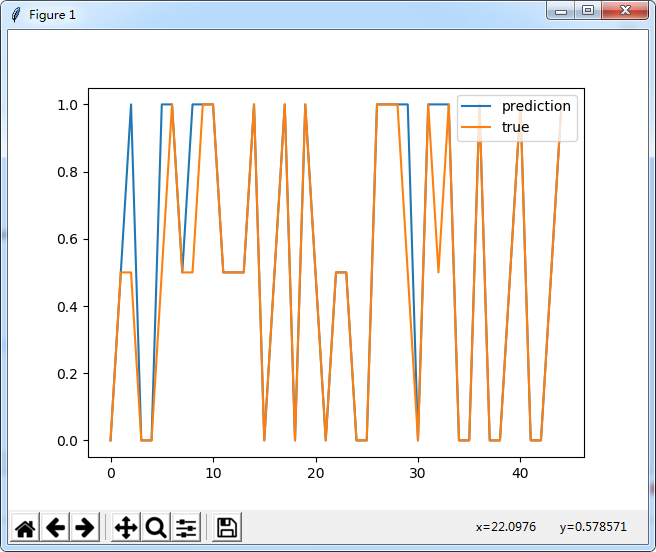
plt.figure()
p1 = plt.plot(t,pre)
p2 = plt.plot(t,y_test,label='test')
label = ['prediction', 'true']
plt.legend(label, loc=1)
plt.show()
acc=accurancy(pre,y_test)
print('The predicted value is ',pre)
print('The true value is ',np.array(y_test))
print('The accuracy rate is ',acc)
输出结果:
The predicted value is [ 0. 0.5 1. 0. 0. 1. 1. 0.5 1. 1. 1. 0.5 0.5 0.5 1.
0. 0.5 1. 0. 1. 0.5 0. 0.5 0.5 0. 0. 1. 1. 1. 1.
0. 1. 1. 1. 0. 0. 1. 0. 0. 0.5 1. 0. 0. 0.5 1. ]
The true value is [0 0.5 0.5 0 0 0.5 1 0.5 0.5 1 1 0.5 0.5 0.5 1 0 0.5 1 0 1 0.5 0 0.5 0.5 0
0 1 1 1 0.5 0 1 0.5 1 0 0 1 0 0 0.5 1 0 0 0.5 1]
The accuracy rate is 0.9444444444444444
附:上述示例中的iris.csv文件点击此处本站下载。
更多关于Python相关内容感兴趣的读者可查看本站专题:《Python数学运算技巧总结》、《Python数据结构与算法教程》、《Python函数使用技巧总结》、《Python字符串操作技巧汇总》及《Python入门与进阶经典教程》
希望本文所述对大家Python程序设计有所帮助。