python绘制直方图和密度图的实例

yipeiwu_com6年前Python基础

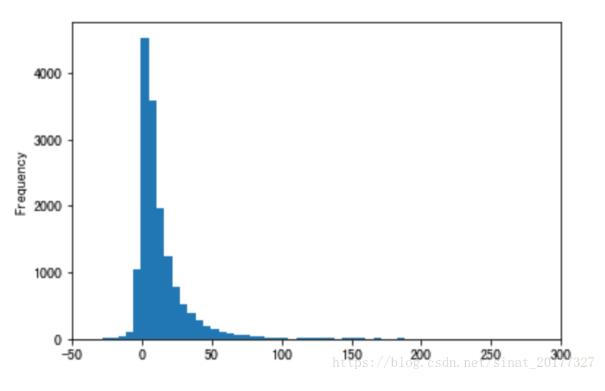
对于pandas的dataframe,绘制直方图方法如下:

//pdf是pandas的dataframe, delta_time是其中一列
//xlim是x轴的范围,bins是分桶个数
pdf.delta_time.plot(kind='hist', xlim=(-50,300), bins=500)

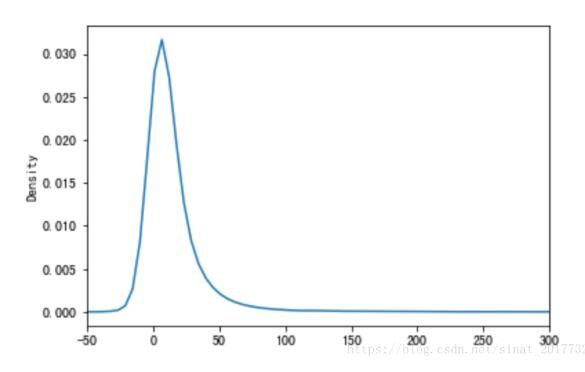
对于pandas的dataframe,绘制概率密度图方法如下:

//pdf是pandas的dataframe, delta_time是其中一列

pdf.delta_time.dropna().plot(kind='kde', xlim=(-50,300))

以上这篇python绘制直方图和密度图的实例就是小编分享给大家的全部内容了,希望能给大家一个参考,也希望大家多多支持【听图阁-专注于Python设计】。

相关文章

python pandas库中DataFrame对行和列的操作实例讲解

用pandas中的DataFrame时选取行或列: import numpy as np import pandas as pd from pandas import Sereis,...

Python Selenium Cookie 绕过验证码实现登录示例代码

Python Selenium Cookie 绕过验证码实现登录示例代码

之前介绍过通过cookie 绕过验证码实现登录的方法。这里并不多余,会增加分析和另外一种方法实现登录。 1、思路介绍  1.1、直接看代码,内有详细注释说明 # File...

简单介绍Python中的len()函数的使用

函数:len() 1:作用:返回字符串、列表、字典、元组等长度 2:语法:len(str) 3:参数: str:要计算的字符串、列表、字典、元组等 4:返回值:字符串、列表、字典、元组等...

python dataframe astype 字段类型转换方法

使用astype实现dataframe字段类型转换 # -*- coding: UTF-8 -*- import pandas as pd df = pd.DataFrame([{'...

由浅入深讲解python中的yield与generator

前言 本文将由浅入深详细介绍yield以及generator,包括以下内容:什么generator,生成generator的方法,generator的特点,generator基础及高级应...