matplotlib命令与格式之tick坐标轴日期格式(设置日期主副刻度)
1.横坐标设置时间格式
import matplotlib.pyplot as plt
import matplotlib.dates as mdates
# 配置横坐标为日期格式
plt.gca().xaxis.set_major_formatter(mdates.DateFormatter('%Y/%m/%d'))
plt.gca().xaxis.set_major_locator(mdates.DayLocator())
例子:
from datetime import datetime
import matplotlib.dates as mdates
import matplotlib.pyplot as plt
# 生成横纵坐标信息
dates = ['01/02/1991', '01/03/1991', '01/04/1991']
xs = [datetime.strptime(d, '%m/%d/%Y').date() for d in dates]
ys = range(len(xs))
# 配置横坐标
plt.gca().xaxis.set_major_formatter(mdates.DateFormatter('%m/%d/%Y'))
plt.gca().xaxis.set_major_locator(mdates.DayLocator())
# Plot
plt.plot(xs, ys)
plt.gcf().autofmt_xdate() # 自动旋转日期标记
plt.show()
2.设置日期坐标轴主副刻度值
所有坐标轴日期格式类型
MinuteLocator: locate minutes(f)
HourLocator: locate hours
DayLocator: locate specified days of the month
WeekdayLocator: Locate days of the week, e.g., MO, TU
MonthLocator: locate months, e.g., 7 for july
YearLocator: locate years that are multiples of base
RRuleLocator: locate using a matplotlib.dates.rrulewrapper. The rrulewrapper is a simple wrapper around adateutil.rrule (dateutil) which allow almost arbitrary date tick specifications. See rrule example.
AutoDateLocator: On autoscale, this class picks the best MultipleDateLocator to set the view limits and the tick locations.
(1)获取坐标轴日期格式类型
from matplotlib.dates import DateFormatter, WeekdayLocator, DayLocator, MONDAY,YEARLY
#获取每月一日数据
monthdays = MonthLocator()
#获取每周一的日期数据
mondays = WeekdayLocator(MONDAY)
#获取每日数据
alldays = DayLocator()
# import constants for the days of the week
from matplotlib.dates import MO, TU, WE, TH, FR, SA, SU
# tick on mondays every week
loc = WeekdayLocator(byweekday=MO, tz=tz)
# tick on mondays and saturdays
loc = WeekdayLocator(byweekday=(MO, SA))
# tick on mondays every second week
loc = WeekdayLocator(byweekday=MO, interval=2)
# tick every 5th easter(每隔5个选1个)
rule = rrulewrapper(YEARLY, byeaster=1, interval=5)
loc = RRuleLocator(rule)
(2)设置坐标轴日期格式
#设置主副刻度
ax.xaxis.set_major_locator(mondays)ax.xaxis.set_minor_locator(alldays)
#设置坐标轴刻度标签格式
mondayFormatter = DateFormatter('%Y-%m-%d') # 如:2-29-2015dayFormatter = DateFormatter('%d') # 如:12ax.xaxis.set_major_formatter(mondayFormatter)
#字符串旋转
for label in ax1.get_xticklabels(): label.set_rotation(30) label.set_horizontalalignment('right')
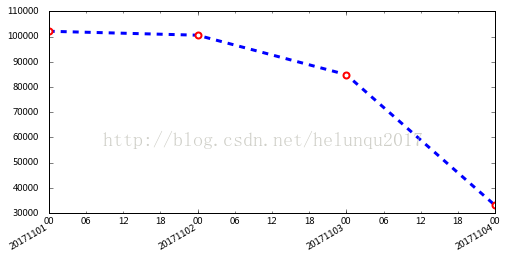
(3)例子
import matplotlib.pyplot as plt
import matplotlib.dates as mdates
from datetime import datetime

#销售数据
dates=[20171101,20171102,20171103,20171104]
sales=[102.1,100.6,849,682]
#将dates改成日期格式
x= [datetime.strptime(str(d), '%Y%m%d').date() for d in dates]

#figure布局
fig=plt.figure(figsize=(8,4))
ax1=fig.add_subplot(1,1,1)
#绘图
ax1.plot(x,y,ls='--',lw=3,color='b',marker='o',ms=6, mec='r',mew=2, mfc='w',label='业绩趋势走向')
plt.gcf().autofmt_xdate() # 自动旋转日期标记

#设置x轴主刻度格式
alldays = mdates.DayLocator()        #主刻度为每天
ax1.xaxis.set_major_locator(alldays)     #设置主刻度
ax1.xaxis.set_major_formatter(mdates.DateFormatter('%Y%m%d'))
#设置副刻度格式
hoursLoc = mpl.dates.HourLocator(interval=6) #为6小时为1副刻度
ax1.xaxis.set_minor_locator(hoursLoc)
ax1.xaxis.set_minor_formatter(mdates.DateFormatter('%H'))
#参数pad用于设置刻度线与标签间的距离
ax1.tick_params(pad=10)

#显示图像
plt.show()
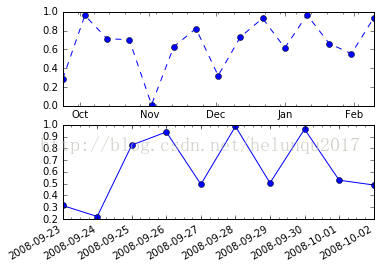
3.设置日期时间刻度值
import matplotlib.pyplot as plt
import numpy as np
import matplotlib as mpl
import datetime as dt

fig = plt.figure()
ax2 = fig.add_subplot(212)
date2_1 = dt.datetime(2008,9,23)
date2_2 = dt.datetime(2008,10,3)
delta2 = dt.timedelta(days=1)
dates2 = mpl.dates.drange(date2_1, date2_2, delta2)
y2 = np.random.rand(len(dates2))
ax2.plot_date(dates2, y2, linestyle='-')
dateFmt = mpl.dates.DateFormatter('%Y-%m-%d')
ax2.xaxis.set_major_formatter(dateFmt)

daysLoc = mpl.dates.DayLocator()
hoursLoc = mpl.dates.HourLocator(interval=6)
ax2.xaxis.set_major_locator(daysLoc)
ax2.xaxis.set_minor_locator(hoursLoc)

fig.autofmt_xdate(bottom=0.18)
fig.subplots_adjust(left=0.18)

ax1 = fig.add_subplot(211)
date1_1 = dt.datetime(2008, 9, 23)
date1_2 = dt.datetime(2009, 2, 16)
delta1 = dt.timedelta(days=10)
dates1 = mpl.dates.drange(date1_1, date1_2, delta1)
y1 = np.random.rand(len(dates1))
ax1.plot_date(dates1, y1, linestyle='--')
monthsLoc = mpl.dates.MonthLocator()
weeksLoc = mpl.dates.WeekdayLocator()
ax1.xaxis.set_major_locator(monthsLoc)
ax1.xaxis.set_minor_locator(weeksLoc)
monthsFmt = mpl.dates.DateFormatter('%b')
ax1.xaxis.set_major_formatter(monthsFmt)

plt.show()
以上就是本文的全部内容,希望对大家的学习有所帮助,也希望大家多多支持【听图阁-专注于Python设计】。