使用Python实现图像标记点的坐标输出功能
Sometimes we have need to interact with an application,for example by marking points in an image,or you need to annotation some training data.PyLab comes with a simple function ginput() the let's you do just that .Here's a short example.
from PIL import Image
from pylab import *
im = array(Image.open('test.jpg'))
imshow(im)
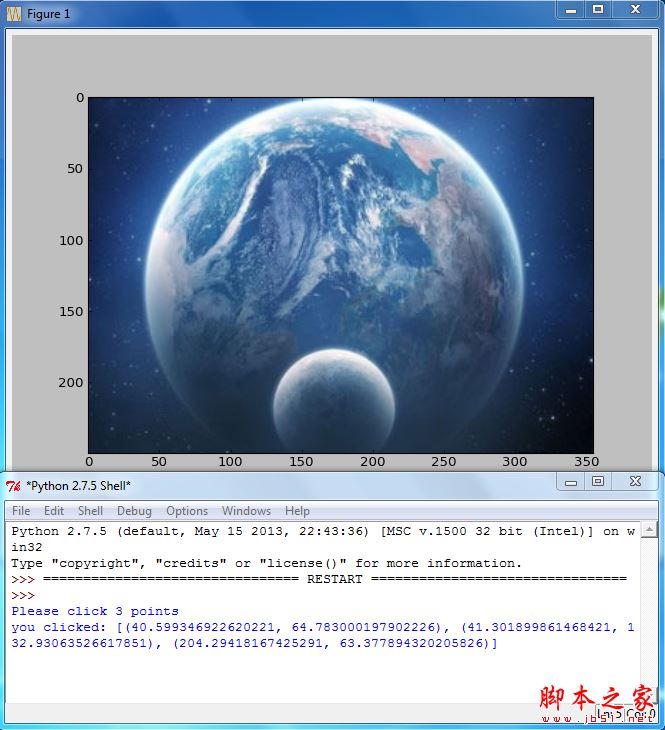
print 'Please click 3 points'
x =ginput(3)
print 'you clicked:',x
show()
This plots an image and waits for the user to click three times in the image region of the figures window.The coordinates[x,y] of the clicks are saved in a list x.
总结
以上所述是小编给大家介绍的使用Python实现图像标记点的坐标输出功能 ,希望对大家有所帮助,如果大家有任何疑问请给我留言,小编会及时回复大家的。在此也非常感谢大家对【听图阁-专注于Python设计】网站的支持!
如果你觉得本文对你有帮助,欢迎转载,烦请注明出处,谢谢!