python实现H2O中的随机森林算法介绍及其项目实战
H2O中的随机森林算法介绍及其项目实战(python实现)
包的引入:from h2o.estimators.random_forest import H2ORandomForestEstimator
H2ORandomForestEstimator 的常用方法和参数介绍:
(一)建模方法:
model =H2ORandomForestEstimator(ntrees=n,max_depth =m)

model.train(x=random_pv.names,y='Catrgory',training_frame=trainData)
通过trainData来构建随机森林模型,model.train中的trainData:训练集,x:预测变量名称,y:预测 响应变量的名称
(二)预测方法:
pre_tag=H2ORandomForestEstimator.predict(model ,test_data) 利用训练好的模型来对测试集进行预测,其中的model:训练好的模型, test_data:测试集。
(三)算法参数说明:
(1)ntrees:构建模型时要生成的树的棵树。
(2)max_depth :每棵树的最大深度。
项目要求:
题目一: 利用train.csv中的数据,通过H2O框架中的随机森林算法构建分类模型,然后利用模型对 test.csv中的数据进行预测,并计算分类的准确度进而评价模型的分类效果;通过调节参 数,观察分类准确度的变化情况。 注:准确度=预测正确的数占样本数的比例
题目二: 通过H2o Flow 的随机森林算法,用同题目一中所用同样的训练数据和参数,构建模型; 参看模型中特征的重要性程度,从中选取前8个特征,再去训练模型,并重新预测结果, 进而计算分类的准确度。
需求完成内容:2个题目的代码,认为最好的准确度的输出值和test数据与预测结果合并 后的数据集,命名为predict.csv
python实现代码如下:
(1) 题目一:
#手动进行调节参数得到最好的准确率
import pandas as pd
import numpy as np
import matplotlib.pyplot as plt
import h2o
h2o.init()
from h2o.estimators.random_forest import H2ORandomForestEstimator
from __future__ import division
df=h2o.import_file('train.csv')
trainData=df[2:]

model=H2ORandomForestEstimator(ntrees=6,max_depth =16)
model.train(x=trainData.names,y='Catrgory',training_frame=trainData)
df2=h2o.import_file('test.csv')
test_data=df2[2:]
pre_tag=H2ORandomForestEstimator.predict(model ,test_data)
predict=df2.concat(pre_tag)
dfnew=predict[predict['Catrgory']==predict['predict']]
Precision=dfnew.nrow/predict.nrow

print(Precision)
h2o.download_csv(predict,'predict.csv')
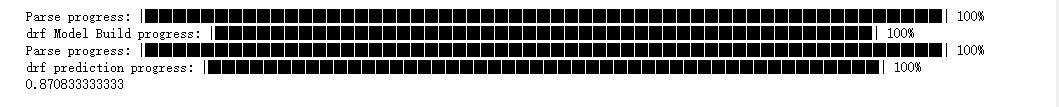
运行结果最好为87.0833%-6-16,如下
#for循环进行调节参数得到最好的准确率
import pandas as pd
import numpy as np
import matplotlib.pyplot as plt
import h2o
h2o.init()
from h2o.estimators.random_forest import H2ORandomForestEstimator
from __future__ import division
df=h2o.import_file('train.csv')
trainData=df[2:]
df2=h2o.import_file('test.csv')
test_data=df2[2:]
Precision=0
nt=0
md=0
for i in range(1,50):
    for j in range(1,50):
      model=H2ORandomForestEstimator(ntrees=i,max_depth =j)
      model.train(x=trainData.names,y='Catrgory',training_frame=trainData)
      pre_tag=H2ORandomForestEstimator.predict(model ,test_data)
      predict=df2.concat(pre_tag)
      dfnew=predict[predict['Catrgory']==predict['predict']]
      p=dfnew.nrow/predict.nrow
      if Precision<p:
        Precision=p
        nt=i
        md=j

print(Precision)
print(i)
print(j)
h2o.download_csv(predict,'predict.csv')
运行结果最好为87.5%-49-49,如下

(2)题目二:建模如下,之后挑出排名前8的特征进行再次建模

#手动调节参数得到最大准确率
import pandas as pd
import numpy as np
import matplotlib.pyplot as plt
import h2o
h2o.init()
from h2o.estimators.random_forest import H2ORandomForestEstimator
from __future__ import division
df=h2o.import_file('train.csv')
trainData=df[['Average_speed','r_a','r_b','v_a','v_d','Average_RPM','Variance_speed','v_c','Catrgory']]
df2=h2o.import_file('test.csv')
test_data=df2[['Average_speed','r_a','r_b','v_a','v_d','Average_RPM','Variance_speed','v_c','Catrgory']]

model=H2ORandomForestEstimator(ntrees=5,max_depth =18)
model.train(x=trainData.names,y='Catrgory',training_frame=trainData)

pre_tag=H2ORandomForestEstimator.predict(model ,test_data)
predict=df2.concat(pre_tag)
dfnew=predict[predict['Catrgory']==predict['predict']]
Precision=dfnew.nrow/predict.nrow

print(Precision)
h2o.download_csv(predict,'predict.csv')
运行结果最好为87.5%-5-18,如下

#for循环调节参数得到最大正确率
import pandas as pd
import numpy as np
import matplotlib.pyplot as plt
import h2o
h2o.init()
from h2o.estimators.random_forest import H2ORandomForestEstimator
from __future__ import division
df=h2o.import_file('train.csv')
trainData=df[['Average_speed','r_a','r_b','v_a','v_d','Average_RPM','Variance_speed','v_c','Catrgory']]
df2=h2o.import_file('test.csv')
test_data=df2[['Average_speed','r_a','r_b','v_a','v_d','Average_RPM','Variance_speed','v_c','Catrgory']]
Precision=0
nt=0
md=0
for i in range(1,50):
    for j in range(1,50):
      model=H2ORandomForestEstimator(ntrees=i,max_depth =j)
      model.train(x=trainData.names,y='Catrgory',training_frame=trainData)
      pre_tag=H2ORandomForestEstimator.predict(model ,test_data)
      predict=df2.concat(pre_tag)
      dfnew=predict[predict['Catrgory']==predict['predict']]
      p=dfnew.nrow/predict.nrow
      if Precision<p:
        Precision=p
        nt=i
        md=j

print(Precision)
print(i)
print(j)
h2o.download_csv(predict,'predict.csv')
运行结果最好为87.5%-49-49,如下

以上就是本文的全部内容,希望对大家的学习有所帮助,也希望大家多多支持【听图阁-专注于Python设计】。