python实现在多维数组中挑选符合条件的全部元素
问题产生:今天在编写神经网络的Cluster作业时,需要根据根据数据标签用不同的颜色画出数据的分布情况,由此学习到了这种高效的方法。
传统思路:用for循环来挑选符合条件的元素,这样十分浪费时间。
代码示例:
from sklearn.datasets.samples_generator import make_blobs
import numpy as np
import matplotlib.pyplot as plt

#product 20 samples and divide them in 4 different types
X, label_true = make_blobs(n_samples=20,centers=4)
print("Data:{:}".format(X))
print("label_true:{:}".format(label_true))

#eliminate the repeated elements
labels=np.unique(label_true)
print("labels:{:}".format(labels))

#plot
fig = plt.figure()
ax = fig.add_subplot(1, 1, 1)
colors = 'rgbycm'
for index,elem in enumerate(labels):
 position=label_true==elem
 print("position{:}:{:}".format(index,position))
 plt.scatter(X[position,0],X[position,1],label="cluster %d"%elem,color=colors[index%len(colors)])
plt.show()
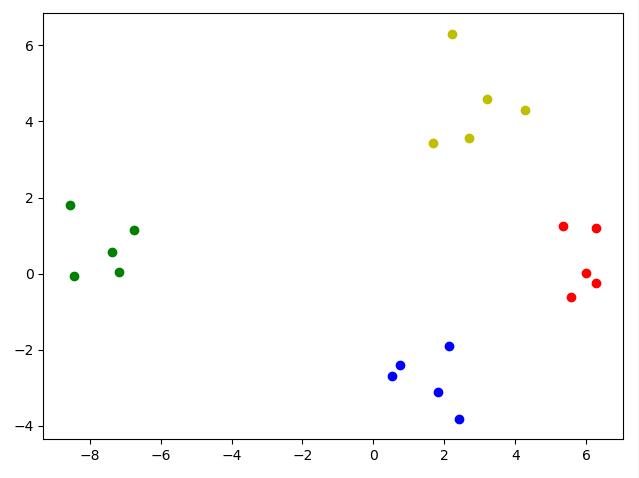
实验结果:
Data:[[ 6.28987299 1.19041843]
 [ 2.12673463 -1.90647309]
 [-8.56276424 1.8136798 ]
 [ 2.42611937 -3.81970786]
 [ 1.83488662 -3.10733306]
 [ 6.28320138 -0.24840258]
 [-6.74802304 1.13642657]
 [ 2.21681643 6.28894411]
 [-7.16100601 0.04482262]
 [ 1.66858847 3.42225284]
 [ 3.19972789 4.58804196]
 [-7.37006942 0.57068008]
 [ 0.52465584 -2.68794047]
 [ 2.71075921 3.57281778]
 [ 5.99343237 0.0120798 ]
 [ 4.28307033 4.28727222]
 [ 0.73714246 -2.38643522]
 [ 5.58384782 -0.62066592]
 [-8.44295576 -0.05933983]
 [ 5.33991984 1.24833992]]
label_true:[0 2 1 2 2 0 1 3 1 3 3 1 2 3 0 3 2 0 1 0]
labels:[0 1 2 3]
position0:[ True False False False False True False False False False False False
 False False True False False True False True]
position1:[False False True False False False True False True False False True
 False False False False False False True False]
position2:[False True False True True False False False False False False False
 True False False False True False False False]
position3:[False False False False False False False True False True True False
 False True False True False False False False]
结果分析:
我们可以看出黄色部分的作用,第一行 position=label_true==elem 的作用是让position在label_true==elem的位置置为True,反之为False,从而得到的position是一个True和False的集合,
而第三行 X[position,0],X[position,1] 就是选择为True的位置上的横坐标和纵坐标,打印出来。还有点懵?我们用最简单的数组来表示
代码示例
import numpy as np
a=np.empty(shape=[0,4], dtype=int)
a=np.append(a,[[1,2,3,4],[2,3,4,5],[7,8,9,10]],axis=0)
position=[True,False,True]
print(a)
print(a[position,3])
结果:
[[ 1 2 3 4]
 [ 2 3 4 5]
 [ 7 8 9 10]]
[ 4 10]
结果分析:
显然这是一个3行4列的矩阵,我们用position得到的是[a[0],a[2]],然后取a[0]和a[2]的第4个元素,则为4和10.
是不是比用for快多了~~
以上这篇python实现在多维数组中挑选符合条件的全部元素就是小编分享给大家的全部内容了,希望能给大家一个参考,也希望大家多多支持【听图阁-专注于Python设计】。