Python绘制二维曲线的日常应用详解
使用Python绘制出类似Excel或者MATLAB的曲线还是比较容易就能够实现的,需要用到的额外库有两个,numpy和matplotlib。使用这两个模块实现的曲线绘制其实在一定程度上更像是MATLAB的plot功能,不过今天看了一下matplotlib网站上的信息,现在的功能更为强劲了,而且已经支持三维图像的绘制。
模块库的安装非常简单,我使用的Mac,在Mac上用pip进行了两个模块库的安装都十分顺畅。相信其他平台基本上也都这样,如果能够联网,这种安装方式是十分推荐的,确实是简单。
我用Python读取我自己日常运动的数据,数据以Numbers的方式进行统计,导出成Excel文件。为了能够读取Excel文件,我又安装了xlrd模块库。
从matplotlib的网站上抄了一小段代码简单做了一下修改,加入了数据读取以及简单的计算,代码如下:
#!/usr/bin/python


 import numpy as np

 import matplotlib.pyplot as plt

 from xlrd import open_workbook


 def SportLine(excel_file):

     days_year  = []

     target_km  = []

     records   = []

     sum_records = []

     pct_records = []

     target_pct  = []


     fig,axs = plt.subplots(3)


     for i in range(365):

         days_year.append(i)


     for day in days_year:

         target_km.append(float(day)/365.0 * 1000.0)


     # read record data

     book = open_workbook(excel_file)

     sheet = book.sheet_by_name('record')

     rows_num = sheet.nrows

     cols_num = sheet.ncols

     for row_num in range(3,368):

         try:

             records.append(float(sheet.cell(row_num,1).value))

         except:

             records.append(0.0)


     # calculate sum of records

     sum_record = 0.0

     for each_record in records:

         sum_record += each_record

         sum_records.append(sum_record)


     # calculate pct of all

     for each_sum in sum_records:

         pct_records.append(each_sum / 1000.0)


     # calculate target pct

     for day in range(1,366):

         target_pct.append(float(day)/365.0)


     # plot target and sum trend

     ax = axs[0]

     ax.plot(days_year,sum_records)

     ax.plot(days_year,target_km)

     ax.set_title('distance-year-km')

     ax.grid(True)


     # plot record

     ax = axs[1]

     ax.plot(days_year,records)

     ax.set_title('distance-day-km')

     ax.grid(True)


     # plot percentage

     ax = axs[2]

     ax.plot(days_year,pct_records)

     ax.plot(days_year,target_pct)

     ax.set_title('pct-100%')

     ax.grid(True)

     plt.show()


 SportLine('records.xlsx')
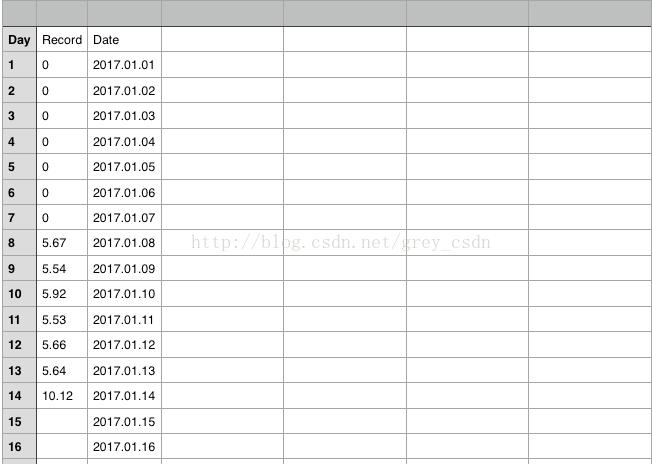
我的运动数据记录电子表格格式如下:
程序运行,画出的曲线如下:
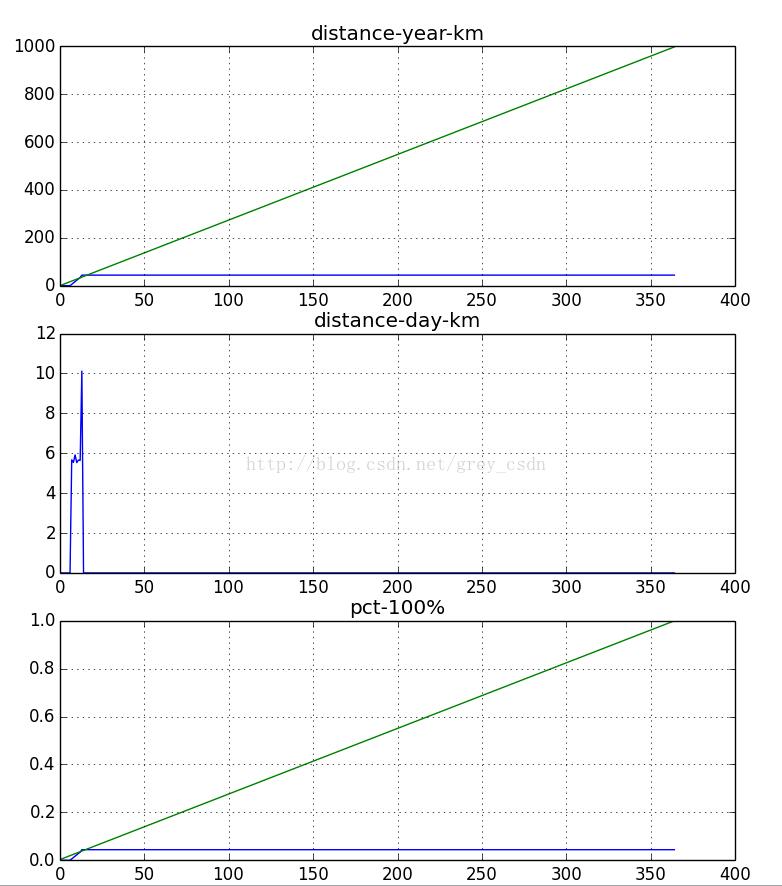
基本差不多了,后面需要做的只有细节上的修正了。
以上这篇Python绘制二维曲线的日常应用详解就是小编分享给大家的全部内容了,希望能给大家一个参考,也希望大家多多支持【听图阁-专注于Python设计】。